Portfolio managers and analysts were drowning in fragmented data. Their real need was trust in the numbers, not more features. Performance, attribution and risk they could take into a board meeting.
Role · Digital Product Designer VP. Led the designSystem · Salt, plus a Fusion layer I builtStatus · Shipped, opened to clientsLive · My public rebuild (opens in new tab) →
Portfolio managers and analysts at asset managers, and in phase two their clients, who'd had no training. Expert users under time pressure, often presenting the screen live.
The job
Performance, attribution and risk they could take into a board meeting, from live and historical data, with heavy filtering.
Where it started
The existing RaaS interface was a legacy layout that couldn't flex to different data or roles.
User personas
My three design personas: the portfolio manager who presents, the analyst who slices, and the client who never had training. Composite roles from the case, not research participants.
Helen Marsh
Portfolio Manager
Asset manager, presents live
“
I need numbers I can take into a board meeting.
Context
Prepares performance, attribution and risk for board meetings, and presents the analysis live.
In this app
Board-ready analytics on Salt
Type, hierarchy and colour set for the worst-case viewing moment
Configurable pages built from widgets
Goals
Performance, attribution and risk for a board meeting
Trust in the numbers, not more features
Present the screen live, under pressure
Pain points
Drowning in fragmented data
A legacy RaaS layout that couldn't flex to different data or roles
Dense data pulling against decision speed
Tom Reilly
Investment Analyst
Returns, attribution and risk
“
Select a cube, slice it, and get to the view that matters fast.
Context
Explores returns, attribution and risk across data cubes to build an analytical view.
In this app
Advanced filtering, toggles and deep slicing
One widget serves many cubes
Import and export through FactSet
Goals
Select a data cube and slice it deep
Analyse returns, attribution and risk across asset classes
Report without leaving the surface
Pain points
Heavy filtering across live and historical data
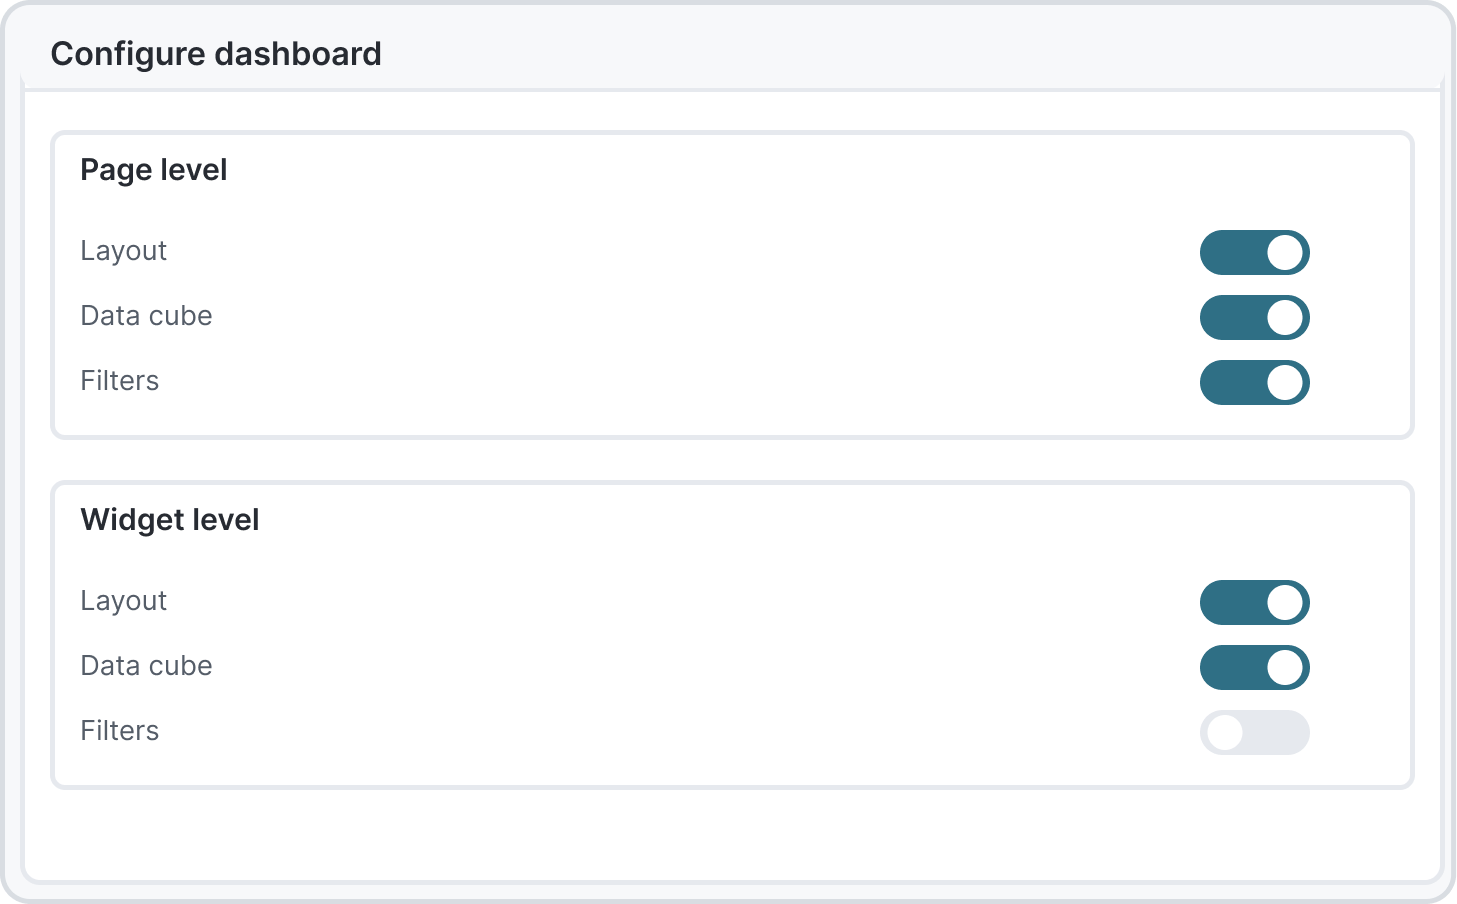
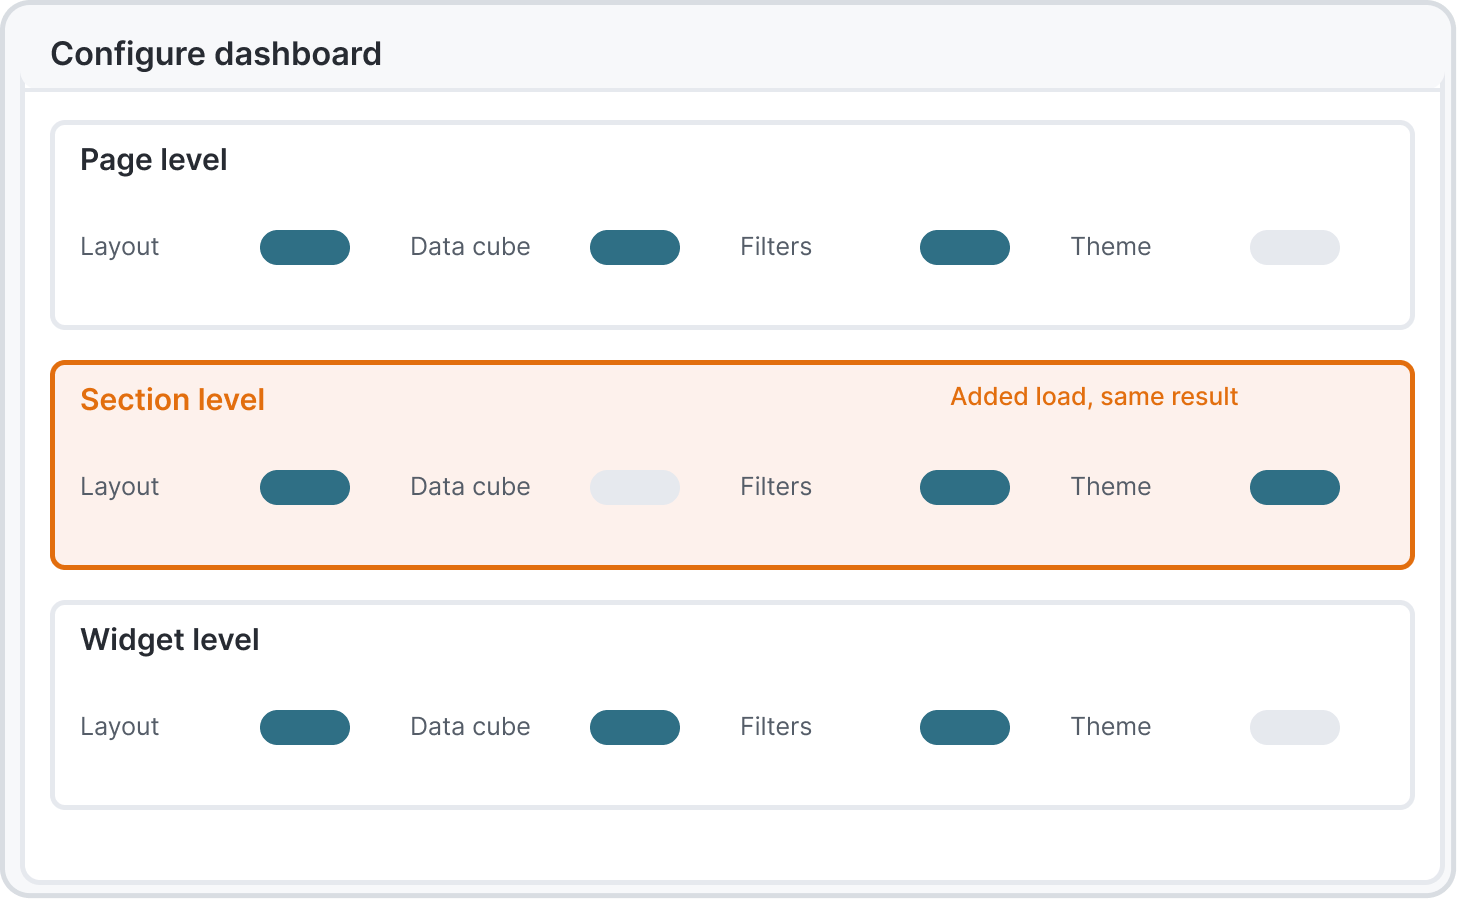
Three levels of configuration, the middle one added load
Every new data cube would have needed a new page
Amara Osei
Client, phase two
Had no training
“
Nobody trained me. It has to make sense on first open.
Context
Uses the client-facing view in phase two, without the training available to internal analysts.
In this app
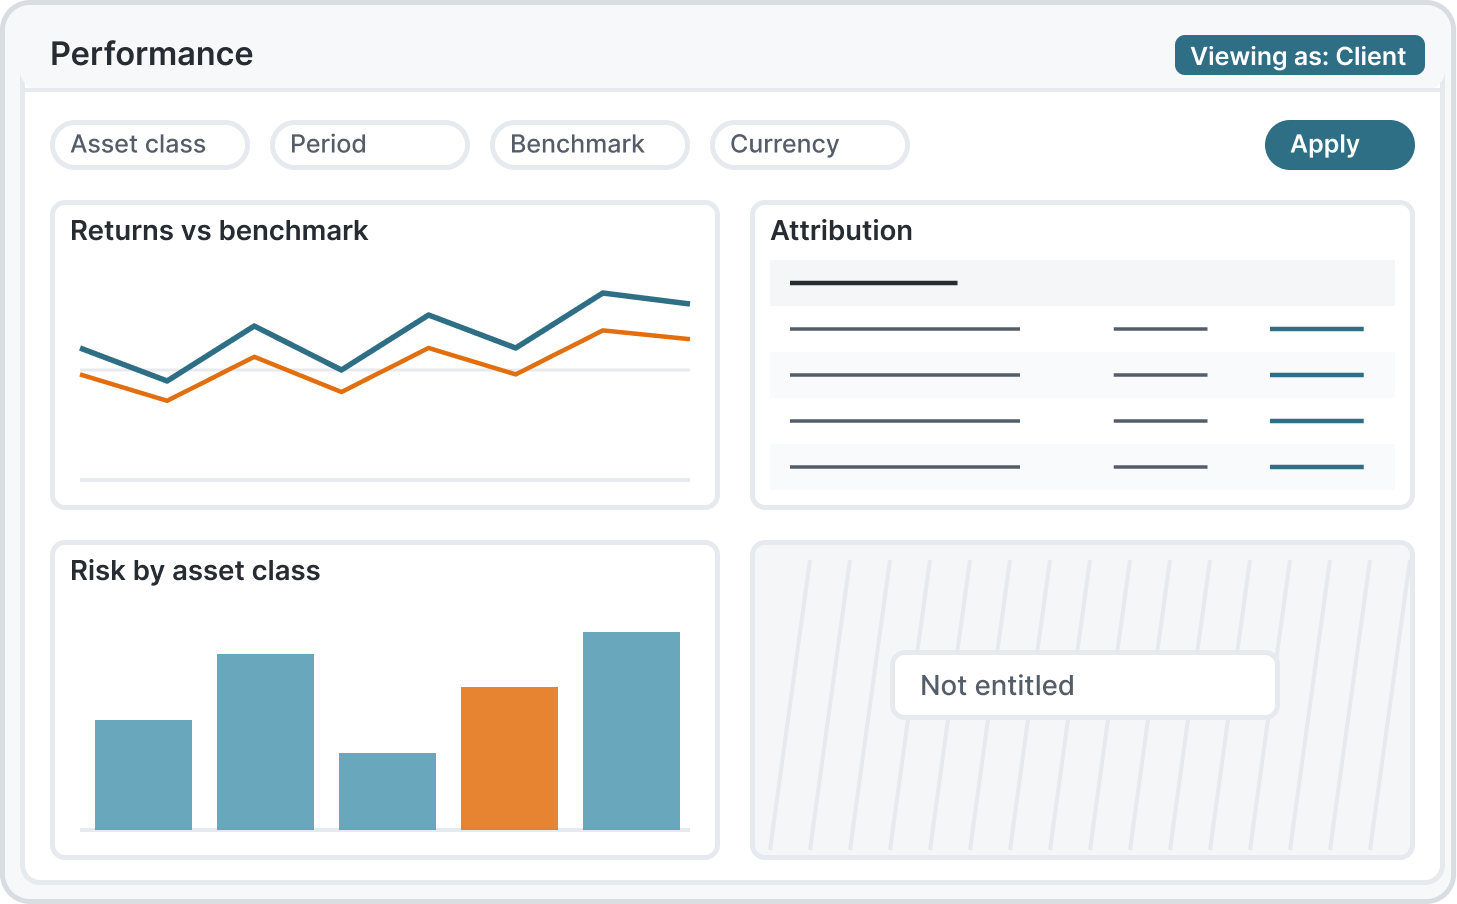
Entitlement-based views
Same screens for internal and external users
One codebase, consistent patterns
Goals
See the part of the book she is entitled to
The same patterns as the internal team
Get to a useful view without onboarding
Pain points
No training before first use
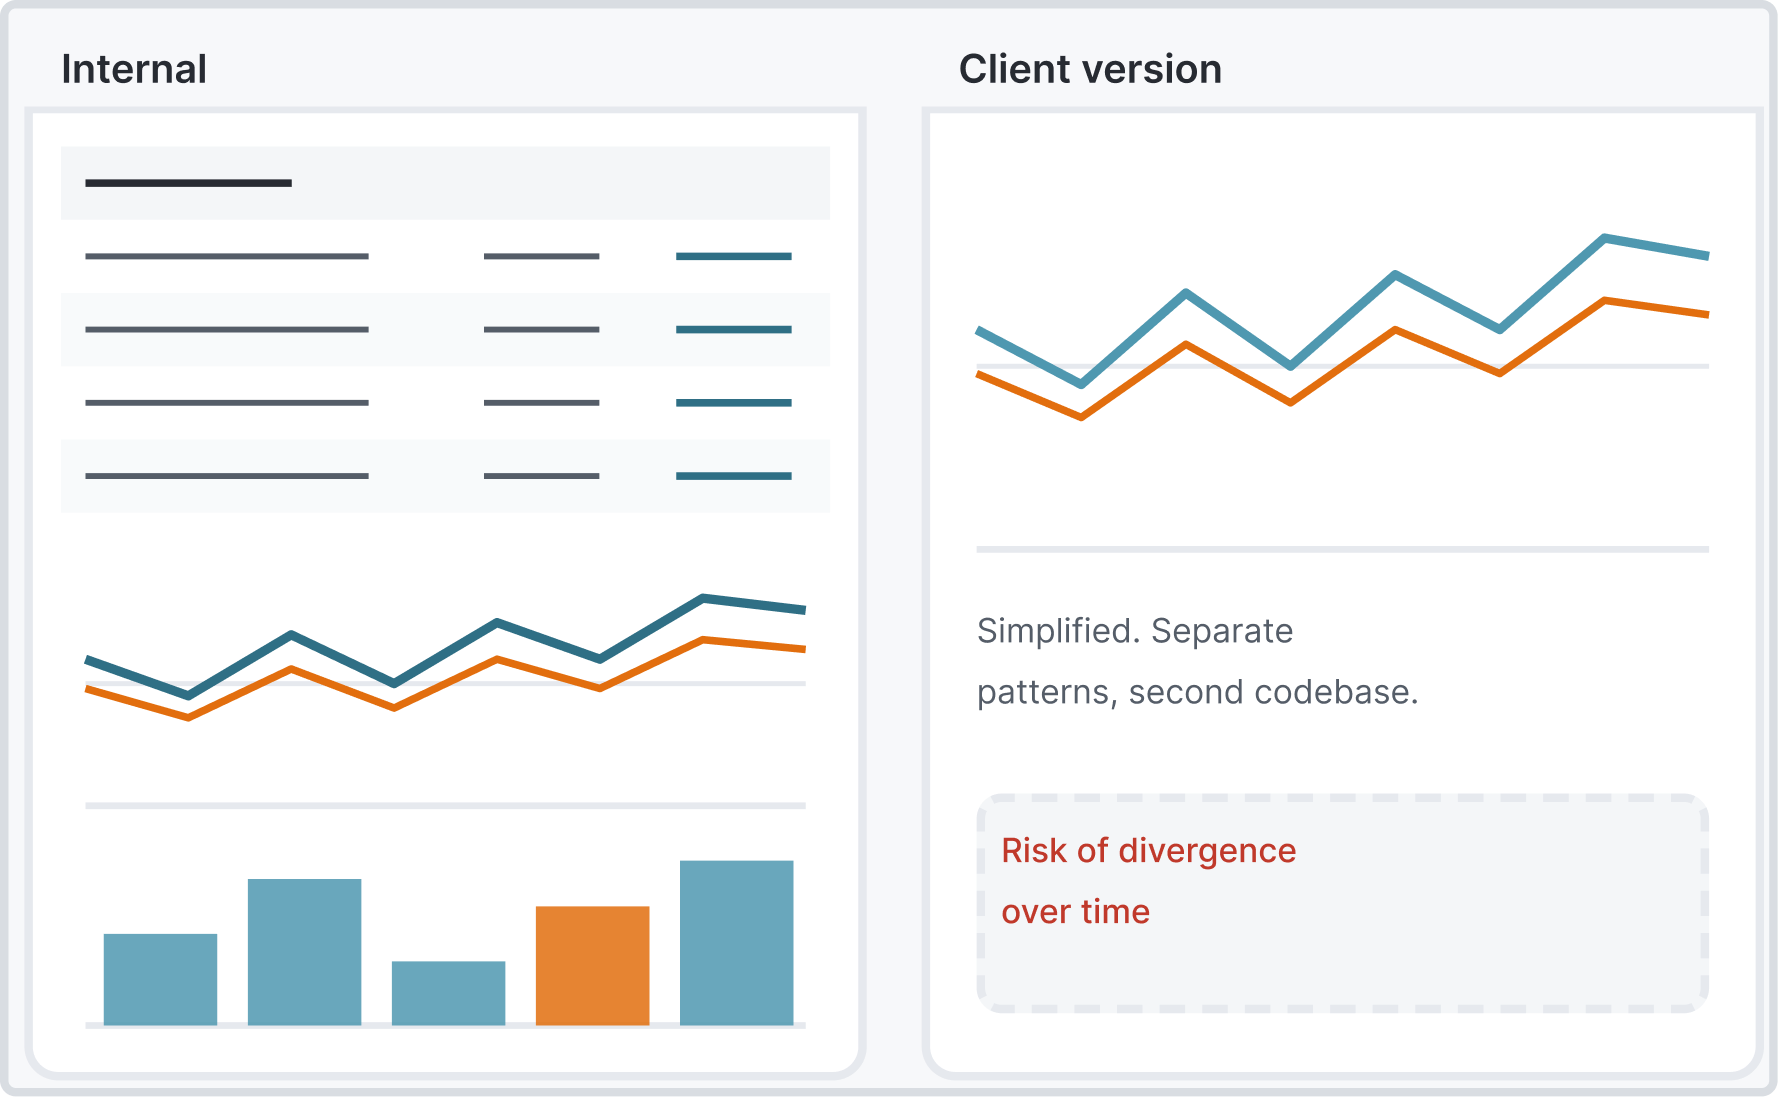
A simplified client version would drift from the product
Permissions differ by person
02 Constraints and role
Iledthedesign.Mostoftheday-to-daycallsweremine.
My role
A UX designer was shared across other projects, so most of the day-to-day calls were mine. A product owner set requirements.
Salt, the firm's design system
Every component had to come from Salt or go back into it. I built the Fusion layer on top and contributed back. My craft shows in layout, hierarchy and data density, not in new components.
Adoption was part of the problem
Some development teams built custom components instead of using the design system's components out of the box. The UI became inconsistent and harder to extend and evolve. I audited the custom components, organised them into groups and reviewed the issues regularly with developers as we worked through the fixes.
FactSet's engine behind the data
The analytics came from a partner engine, so the shape of the data was fixed. Design had to fit what the engine could return, fast.
Accessibility as a gate, not a finish
An accessibility specialist sat in every review. Anything that failed went back before it reached engineering.
Two constraints that pulled against each other
Dense data and decision speed. I named them both, then built the conflict into the design. Type, hierarchy and colour were set for the worst-case viewing moment, someone presenting live under pressure, not the clean demo.
03 Research and workflow
Oneanalyst,fromarawdatacubetoaboard-readypage.
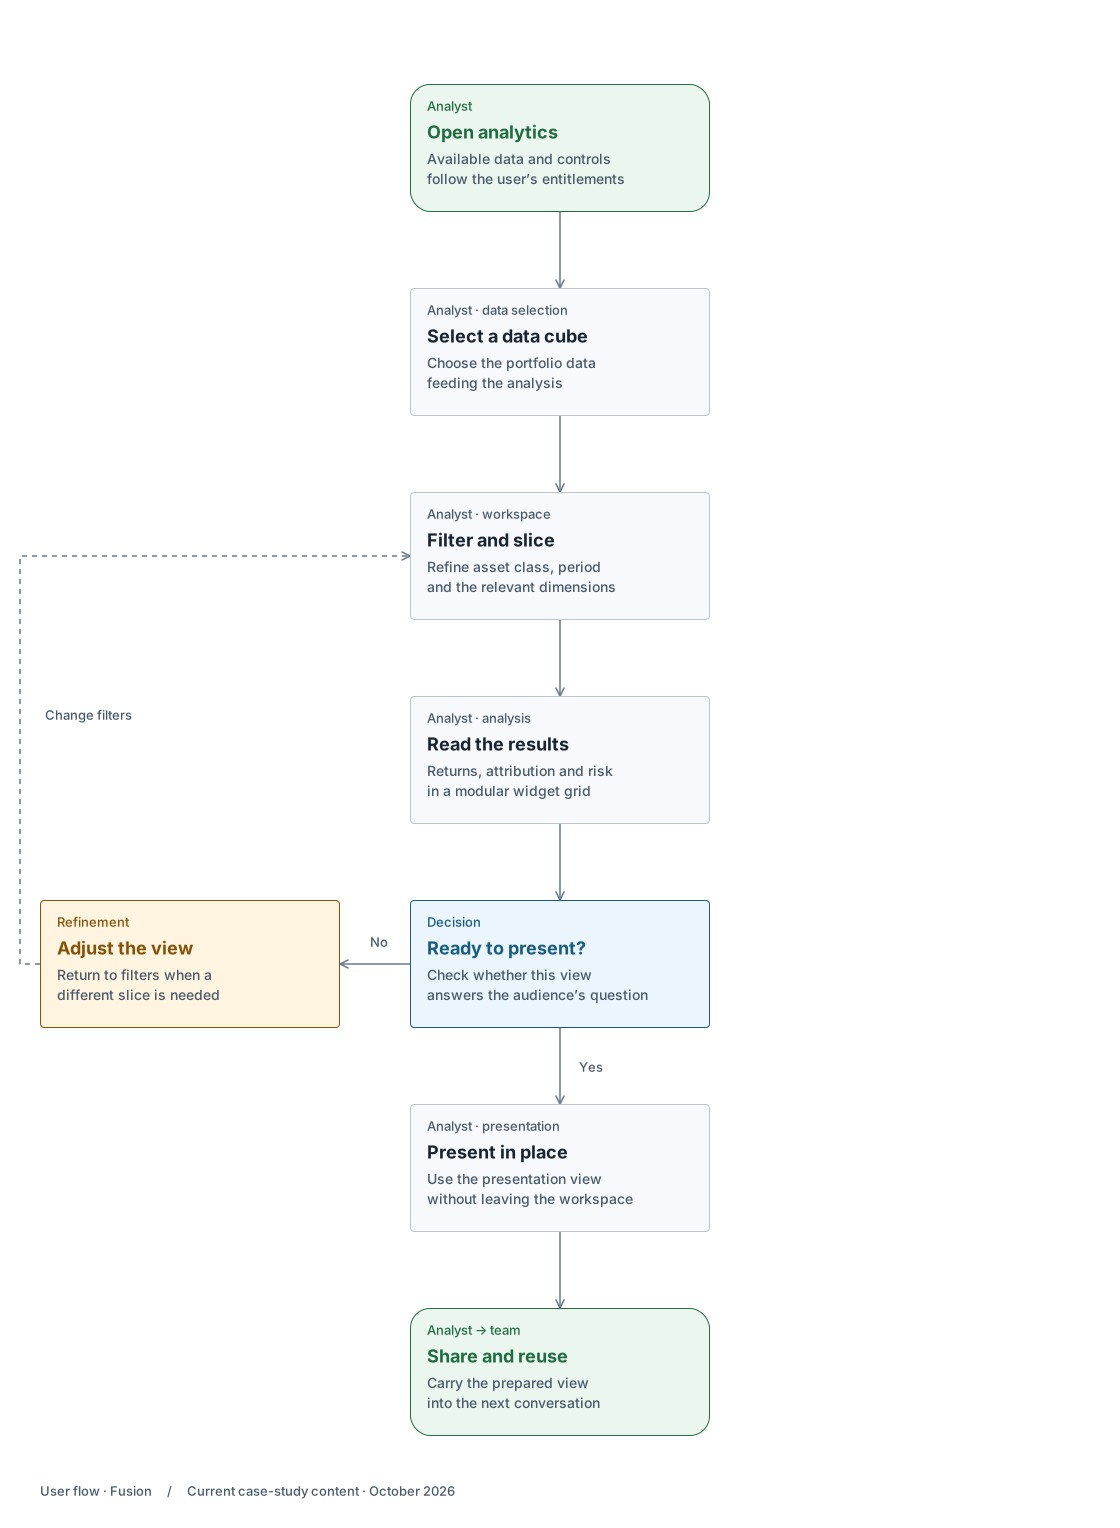
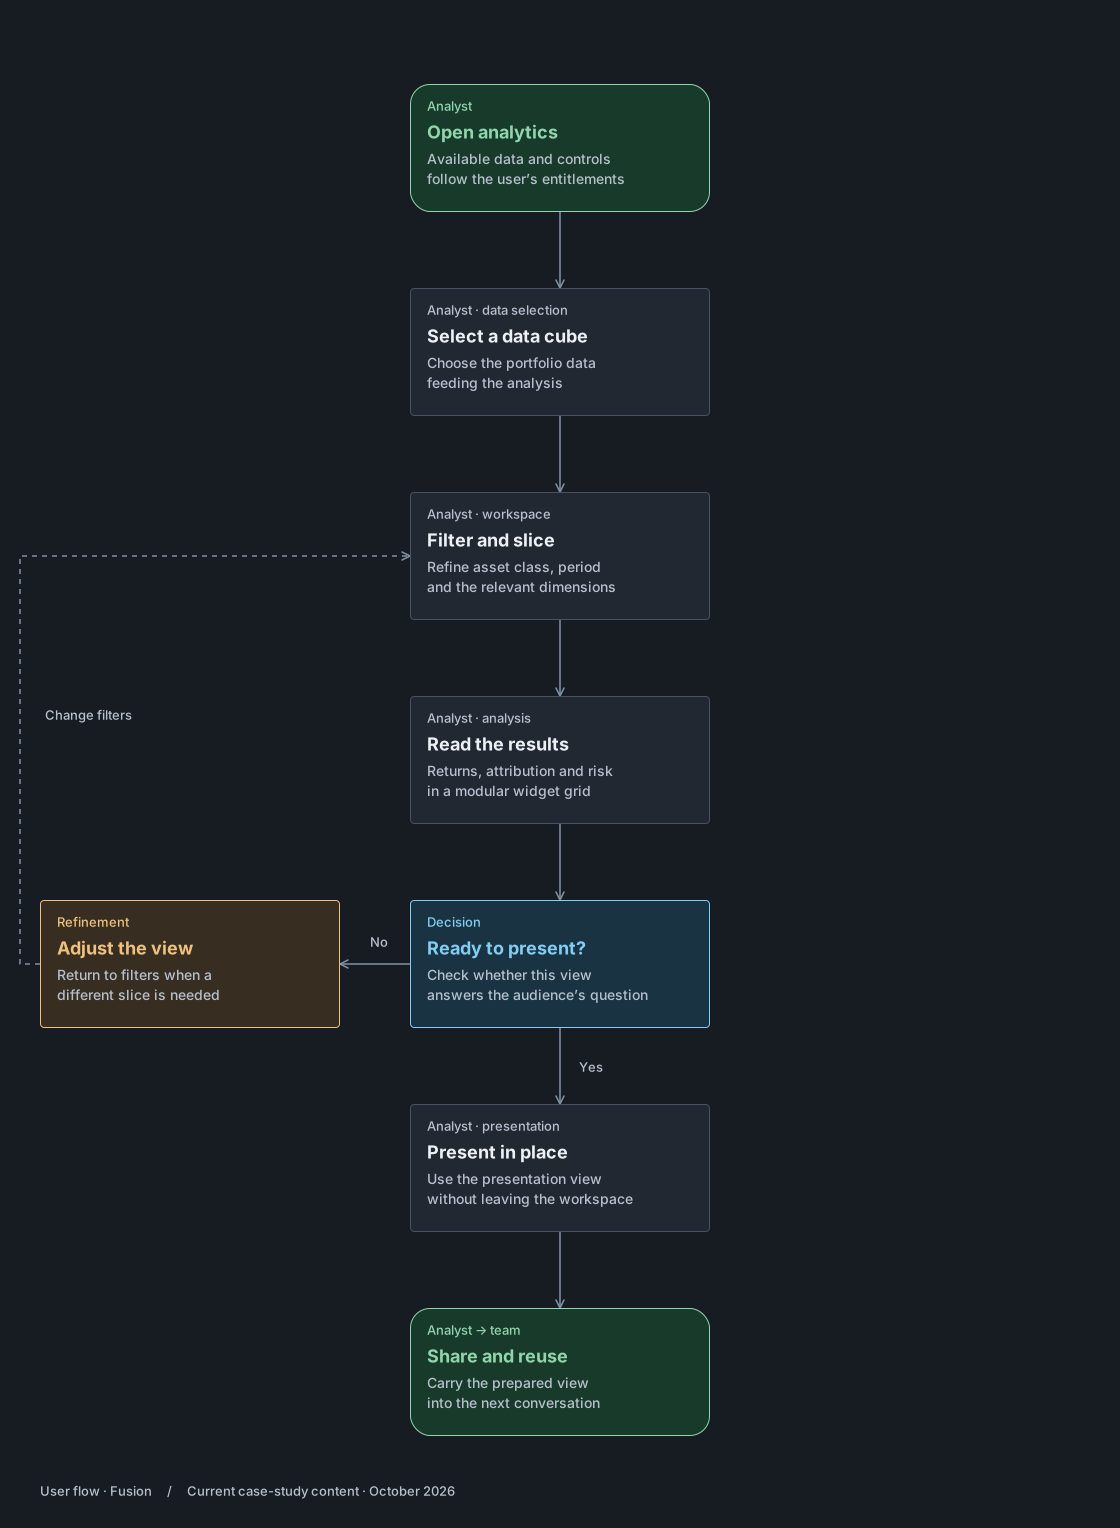
User flow
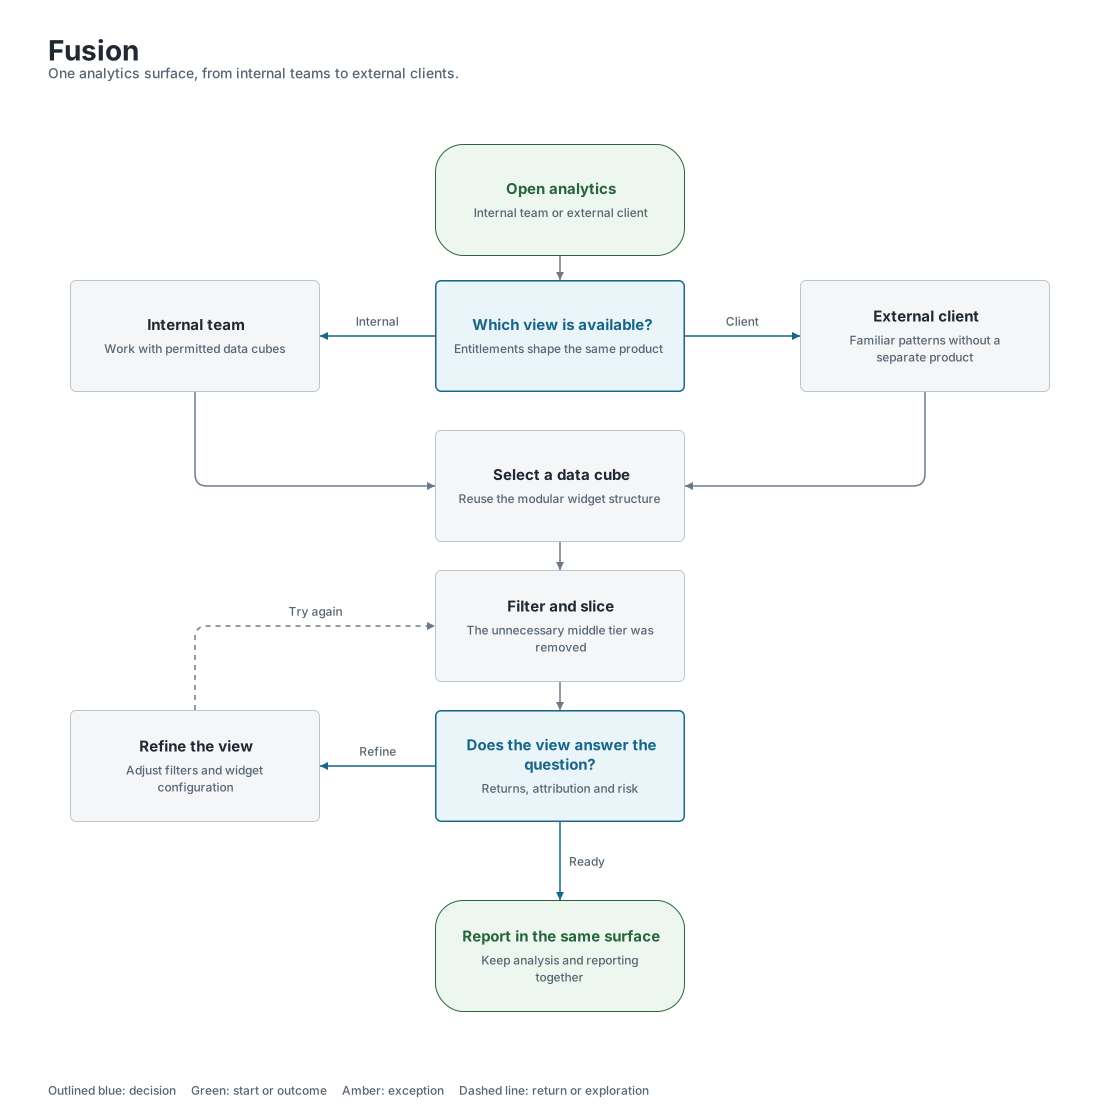
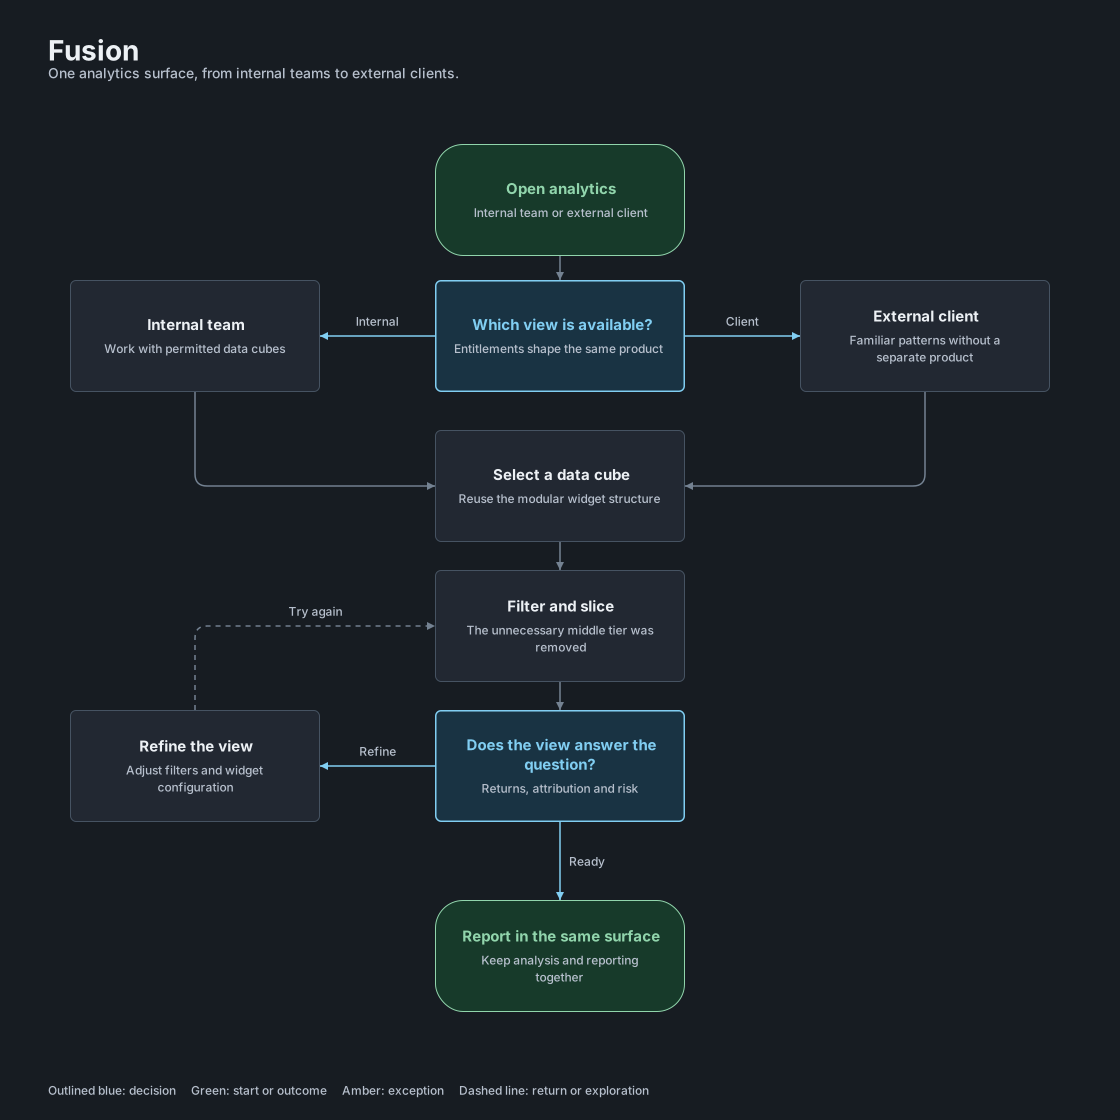
An analyst shapes the workspace, checks the view, then presents and reuses it.
Case-study workflow · entitlement-based access and analytics in the same surface.
On smaller screens, enlarge the flow to read and explore the branches.
Sketch, wireframe, high fidelity
Each flow went through paper, then wireframes, then built screens on Salt. The sketches set the information hierarchy before any visual decision.
The review cycle
Requirements with the product owner, iteration with UX, review with product, engineering and the accessibility specialist, then pixel-level work with developers in daily stand-ups. Accessibility was a review step, not a final check.
What testing changed
The customisation tier I cut came from watching people use the configuration options. The middle tier added choices without changing what they built. Removing it made the first useful view faster to reach.
User journey
Helen Marsh · Portfolio Manager · Asset manager, London · Quarterly board pack, one afternoon
Persona
Helen Marsh
Portfolio Manager
Asset manager, presents live
Scenario
Helen is preparing a quarterly board meeting. She opens Fusion to pull performance, attribution and risk for the book, slices by asset class and period, and builds the view she will present live while the numbers are still updating.
Goal
Walk into the board meeting with numbers she trusts, built in one surface, without a spreadsheet detour.
Start with the book
01Find the data
Helen selects the data cube for her book. FactSet's engine feeds it, so the shape of the data is fixed and the first useful view has to be fast.
Design response
Entitlement-based view on open
Cube picker with recent cubes
What the system does
FactSet engine returns the cube. The shape of the data is fixed, so the first view has to be fast.
Refine the view
Filters and analysis stay in the same workspace.
02Shape the view
Filter and slice: asset class, period, benchmark. The old RaaS layout couldn't flex to different data or roles.
Design response
Advanced filtering, toggles, deep slicing
Comparison tools tailored to data complexity and role
Two configuration levels, not three
What the system does
Salt filter bar and toggles. Entitlements decide which options each person sees.
03Analyse
Returns, attribution and risk across asset classes, in widgets that work across cubes and permission levels.
Design response
Modular widgets
Data tables and chart frames on Salt
What the system does
One widget shell renders a table or a chart from the same data contract, across cubes.
Back to filters when the view needs to change.
Take the view into the room
The audience changes. The data stays in the same surface.
04Present
She presents the screen live, under pressure. Type, hierarchy and colour were set for this moment, not the clean demo.
Design response
Board-ready report without leaving the surface
Worst-case viewing moment as the baseline
What the system does
Dashboard page configuration saved per user. Accessibility specialist reviews before release.
05Share and reuse
Phase two: the same screens reach external clients who had no training. One codebase, entitlement decides what each person sees.
Design response
Import and export through FactSet
Same patterns for internal and external users
Patterns reused across other Fusion modules
What the system does
One codebase. Entitlement-based views for clients. Import and export through FactSet.
Opportunities
Get in front of end users directly and earlier. The start leaned on product-owner requirements. Ship a leaner version one with fewer modules, and keep the accessibility specialist involved from the first review.
04 Decisions and trade-offs
WhatItried,whatIdropped,andwhy.
Decision map
The dashboard had to support different data, different decisions and different permissions. These calls address reuse, configuration effort and the move to external clients.
On smaller screens, enlarge the map to read and explore the branches.
Reuse without repeated setup
Widgets let the same structure serve different cubes. Removing the middle configuration tier limits how much setup that flexibility asks of the user.
One structure, different access
The same page and widget patterns then support external clients through entitlements, with review of what each audience can see.
Shipped and reused
01Dashboard structure
Should each report have its own page, or share a widget structure?
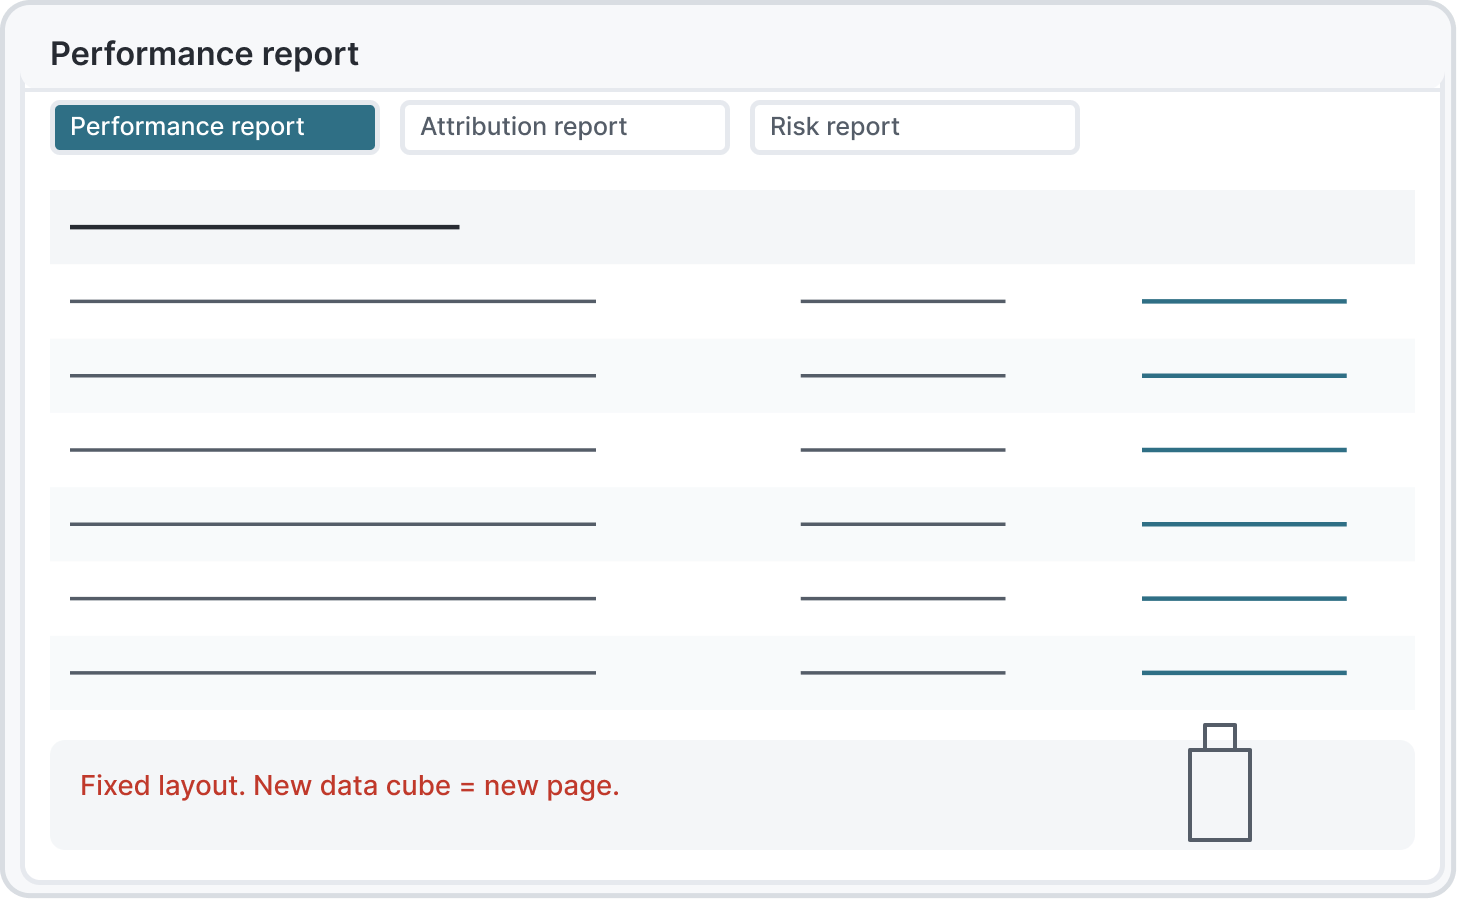
Performance, attribution and risk draw on different data cubes. Fixed pages make the first report straightforward but make each new combination another layout to maintain.
I chose
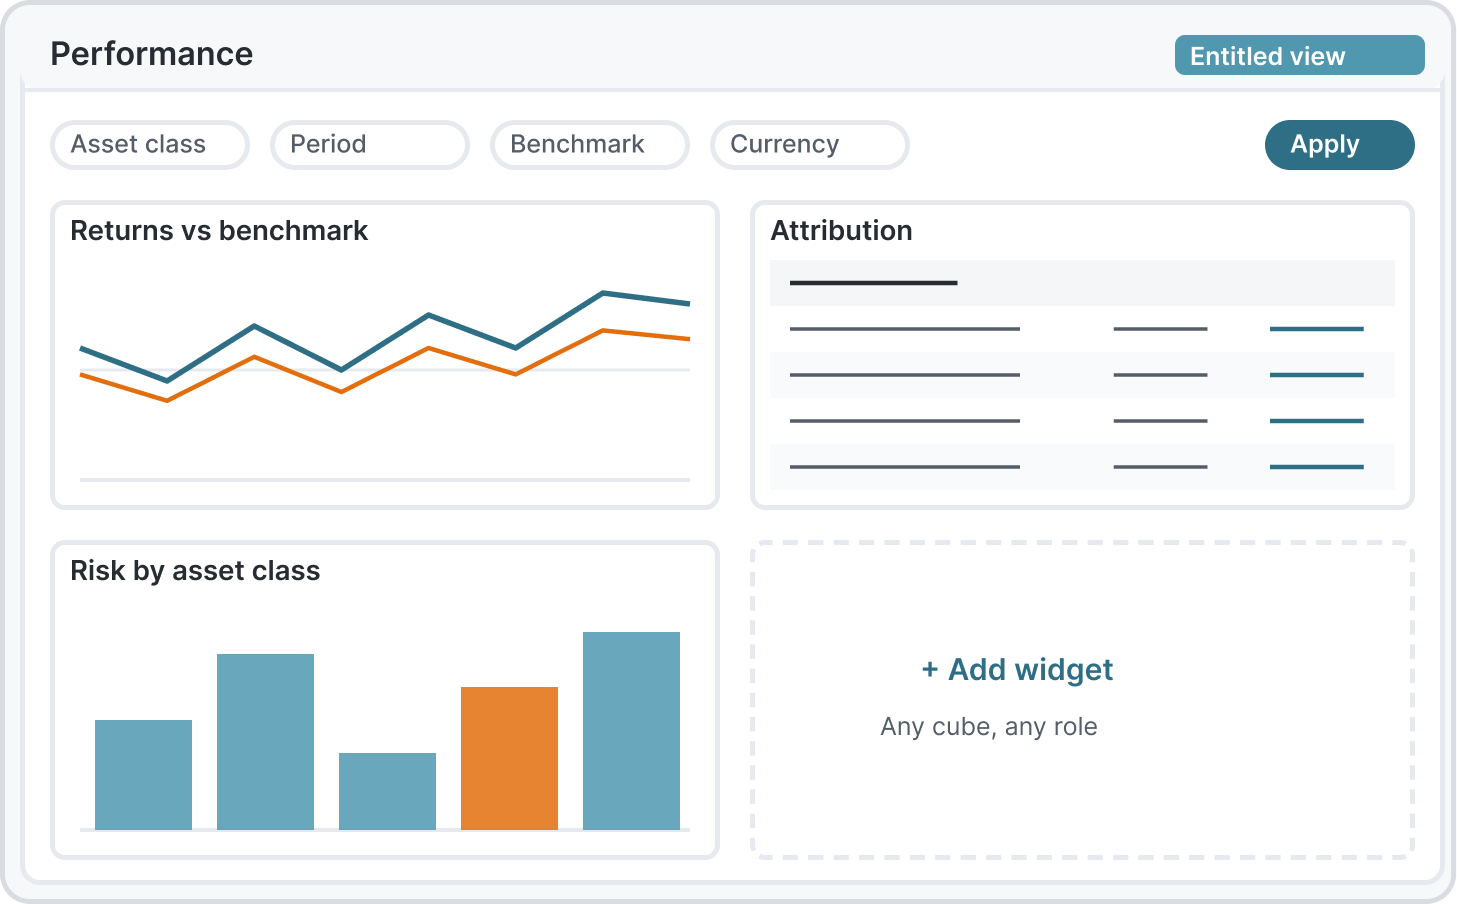
Modular widgets
Reuse widgets across data cubes and permission levels.
Alternative
Fixed layouts per report type
Build a fixed page for each report type and data combination.
Why I chose it
We explored fixed layouts per report type and a widget grid. Fixed layouts were faster to ship, but every new data cube would have needed a new page. The grid won because one widget serves many cubes and permission levels.
What it cost
Slower to ship than fixed layouts, and every widget had to earn its place in one of the four workflow steps.
What informed the decision
I watched internal users configure pages during weekly reviews on their own portfolios and used their choices to shape the default layout. Other Fusion teams later reused the widget and filtering patterns.
Simplified after review
02Configuration
How much configuration actually changes the view someone needs?
The first design offered page, section and widget settings. The middle level added another place to look before reaching the same result.
I chose
Cut a customisation tier
Keep page and widget configuration; remove the section tier.
Alternative
Three levels of configuration
Retain three levels and the extra choices for each level.
Why I chose it
Early versions had three levels of configuration. Testing showed the middle tier added cognitive load without changing what people built. I removed it. The test I use for what not to design: is this serving a real workflow contradiction, or one team's preference?
What it cost
Removing a level also removes a place to configure a section independently. I kept the page and widget controls that supported the useful views.
What informed the decision
I watched people use the three levels during the same reviews. The middle tier added choices without changing what they built. This was not a timed study, so there is no measured speed improvement.
Opened to clients in phase two
03Phase two
Should external clients get a separate product?
Phase two brought in clients without training. A second interface would add another set of patterns to maintain; a shared one had to respect their narrower permissions.
I chose
One product with entitlement-based views
Keep a shared product and make the permitted view work for each role.
Alternative
A simplified client version
Create a separate simplified client interface alongside the internal product.
Why I chose it
Phase two brought in clients who'd had no training. We chose one product with entitlement-based views over a simplified client version, so patterns stayed consistent and the team kept one codebase.
What it cost
Client constraints live in the same codebase as the internal views.
What informed the decision
The client-facing team informed the work, and two clients tested before phase two widened. That is a limited review record, not evidence that every client needed no support.
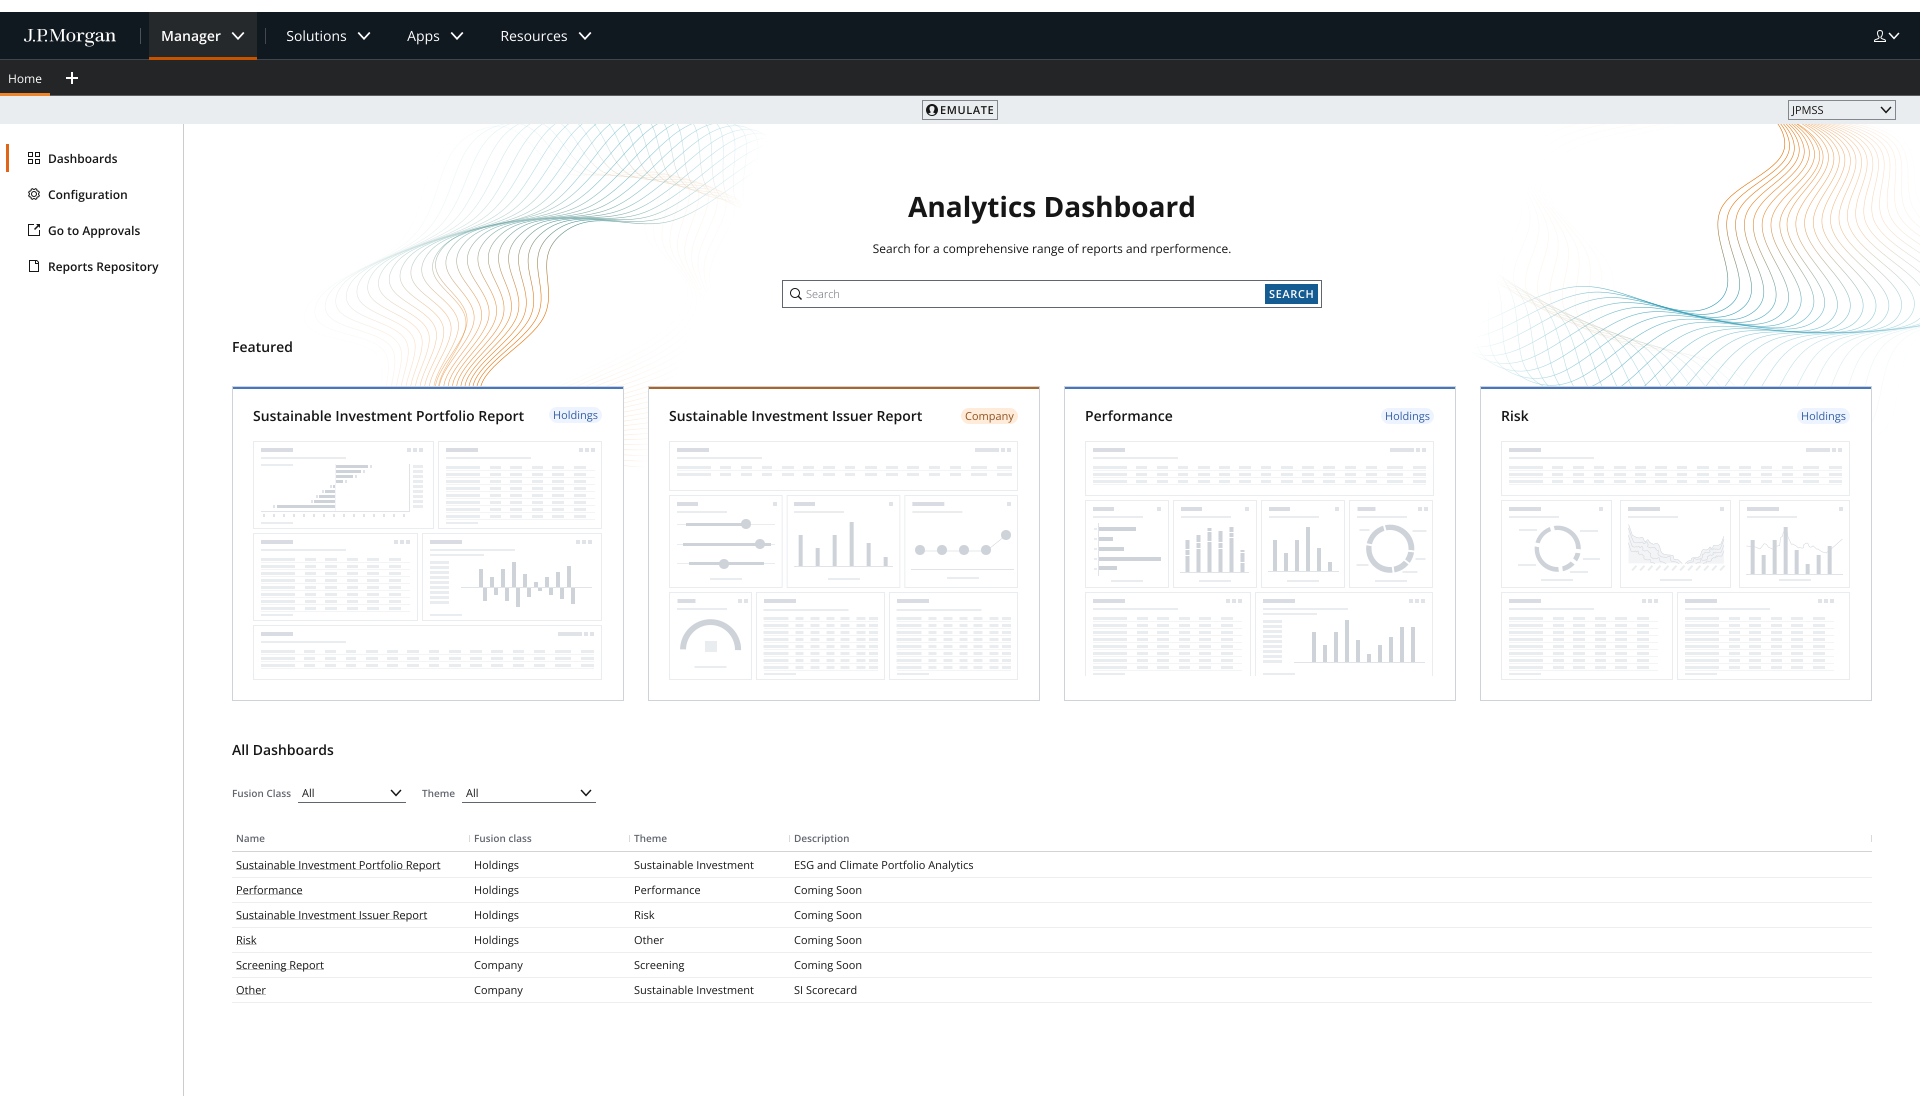
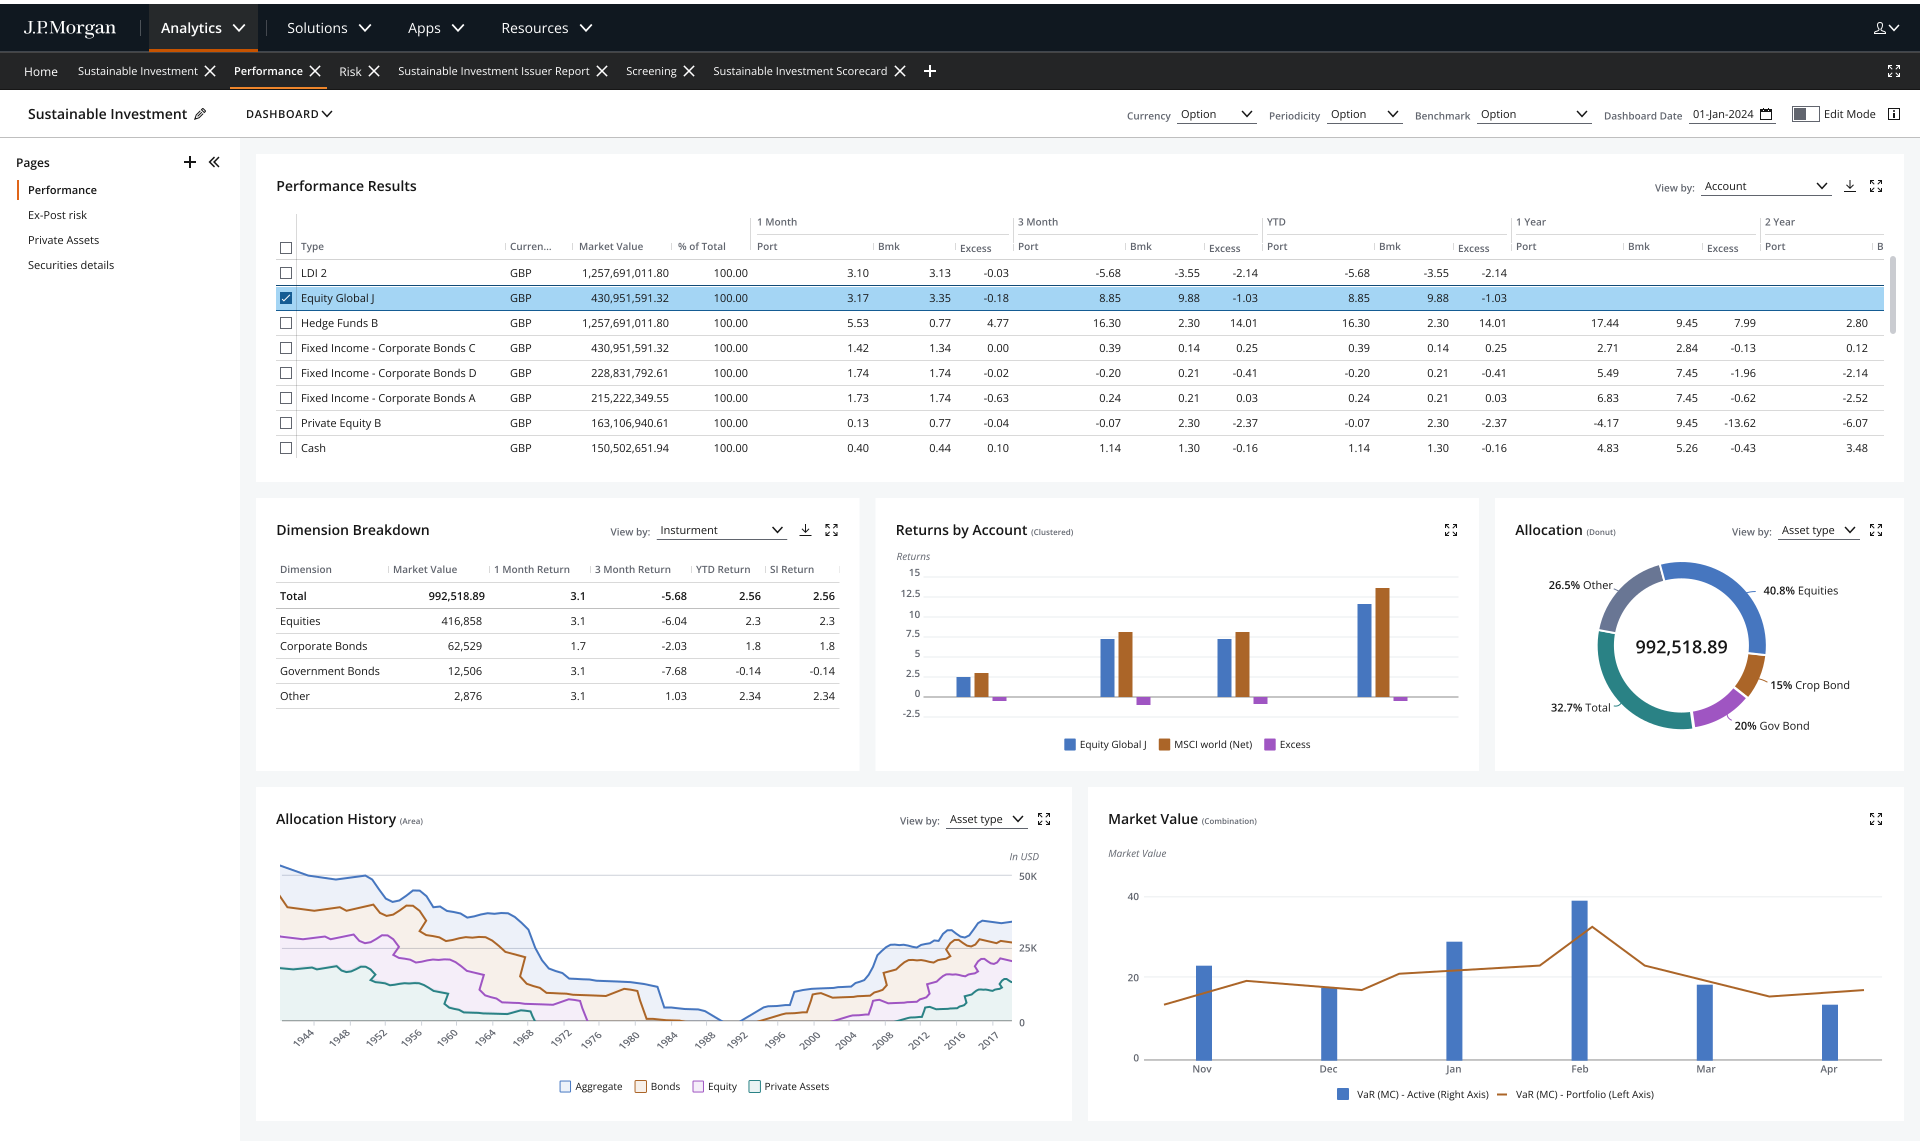
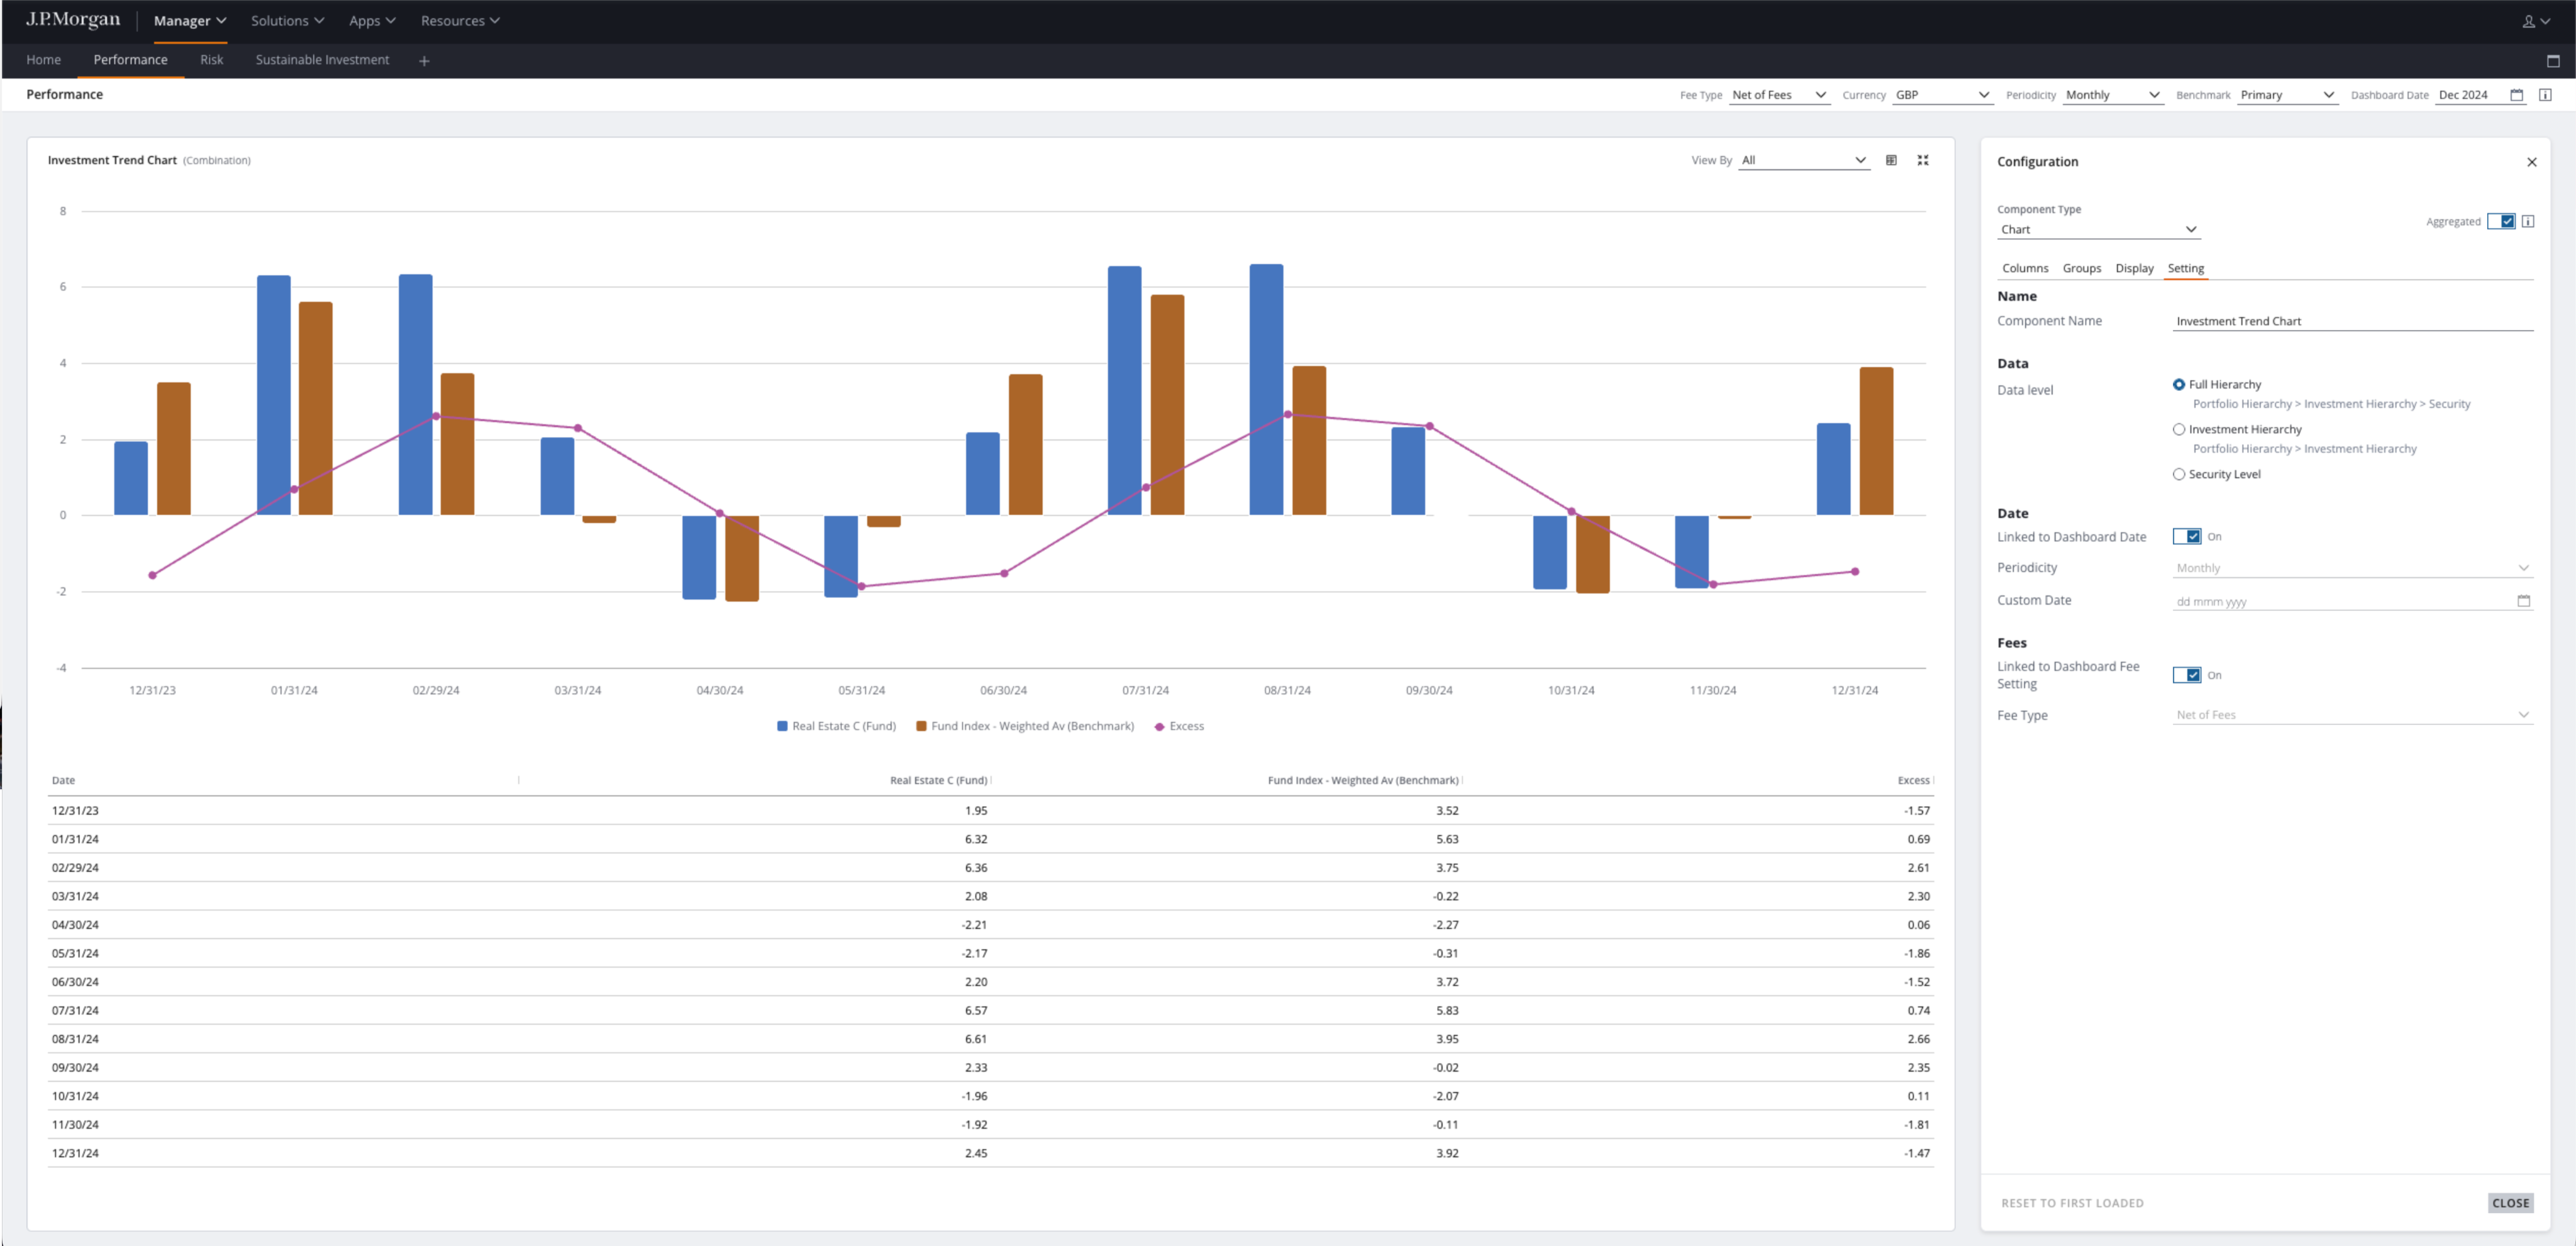
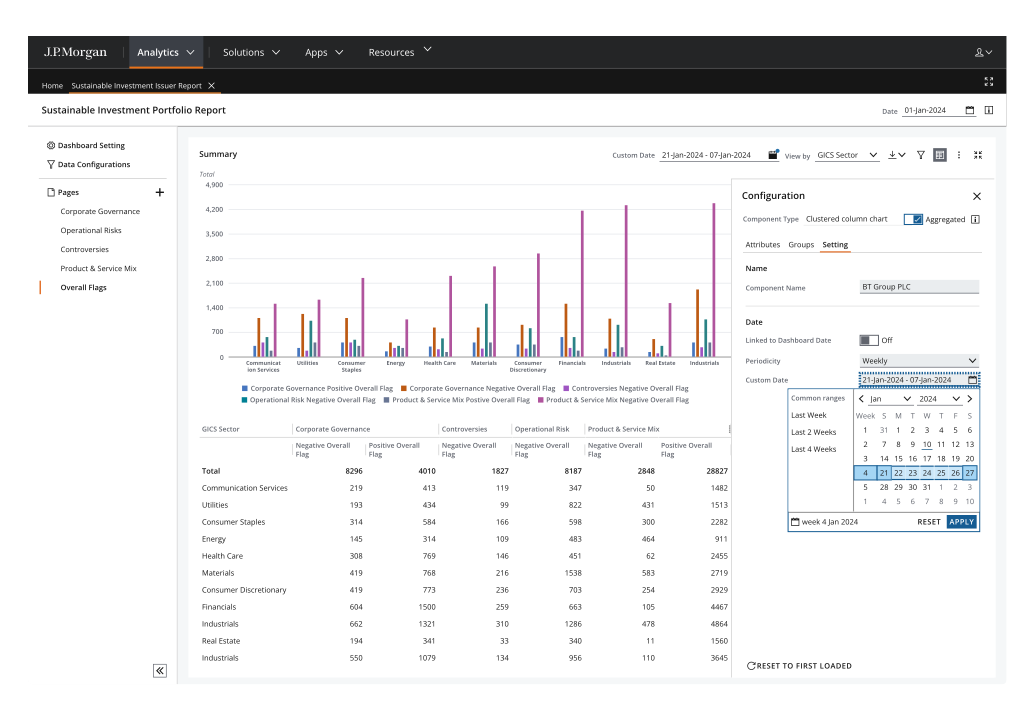
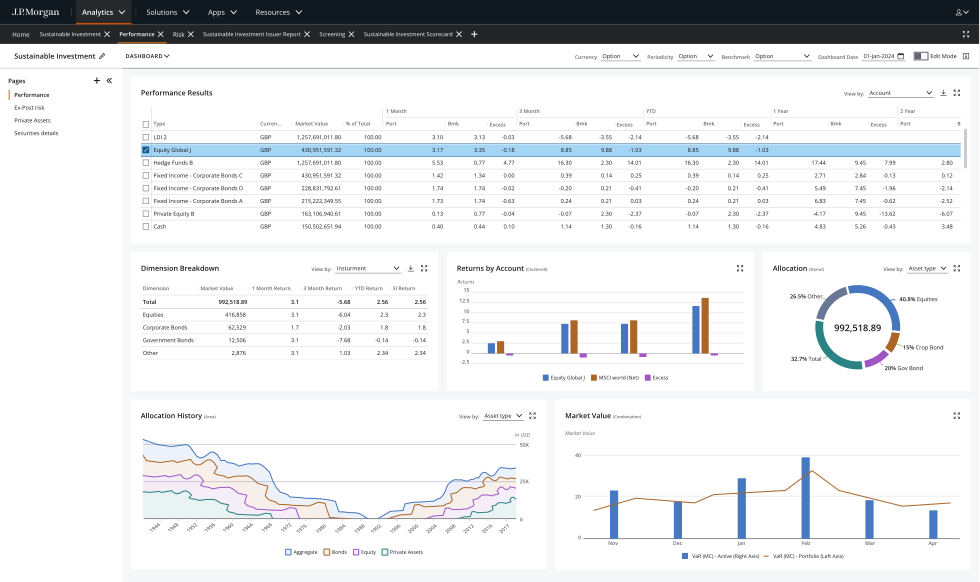
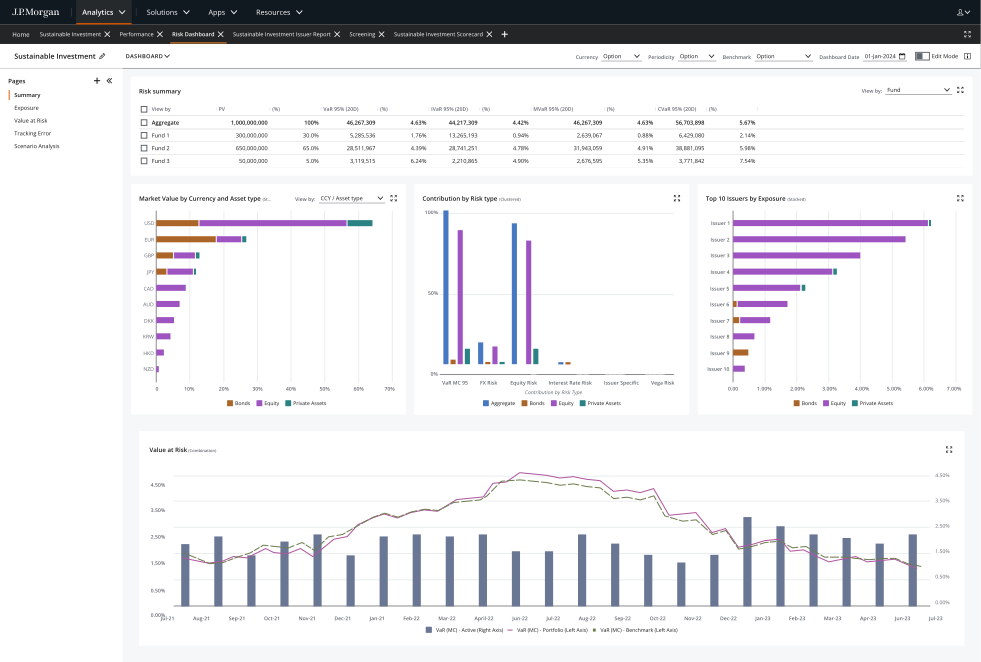
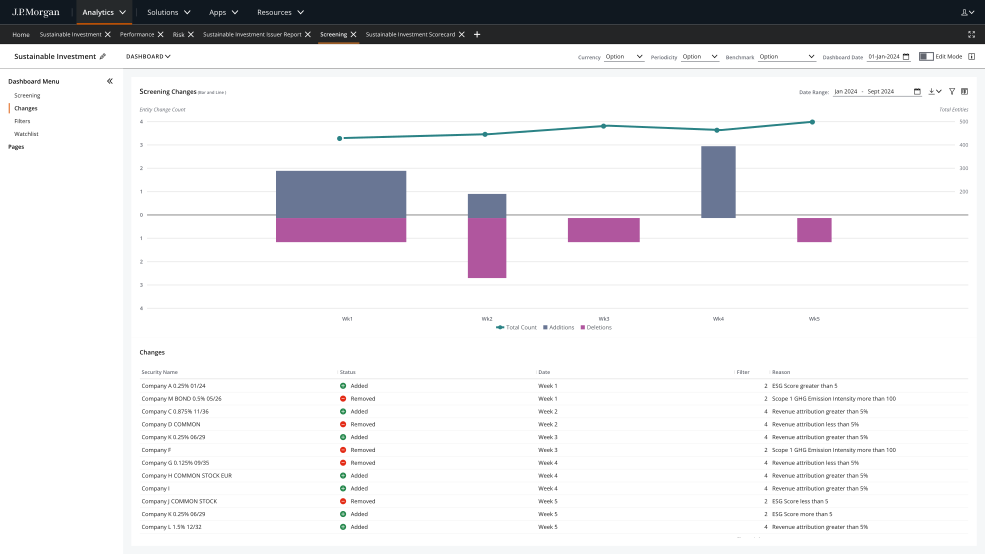
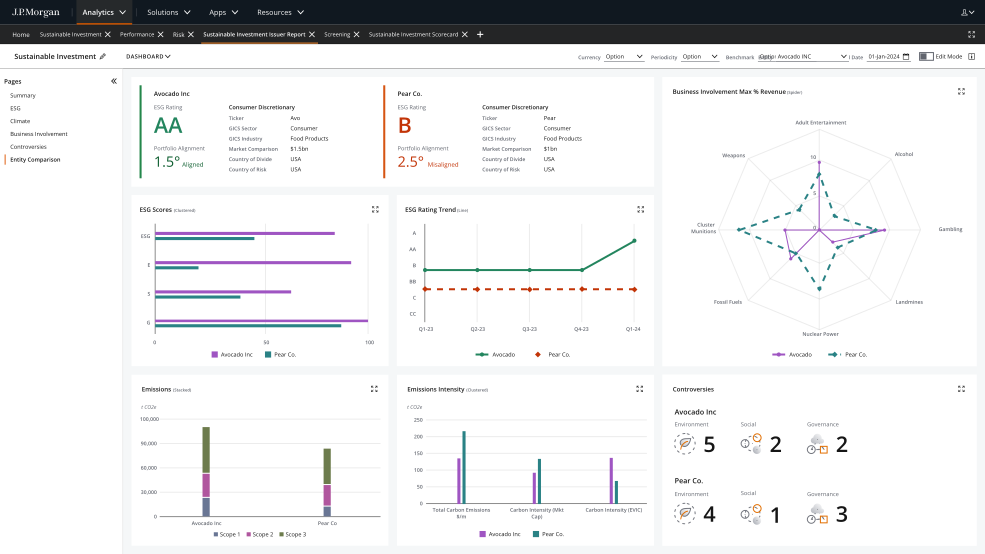
The screens below are my original Fusion designs. The recording shows my public rebuild using sample data. FactSet integration and entitlement-based access describe the original project; those services are not connected to the rebuild.
Silent recording. It moves from report discovery into the Performance workspace, opens its configuration panel, then shows Sustainable Investment.
Before Fusion, I helped define the foundation
I worked on UITK, now Salt, on the design language, the look and the feel. I ran the design system workshops in London and New York with design, product and development in the same room. The point wasn't to present. It was to agree what a component is before anyone built it. On Execute, I worked with developers from day one, weekly working sessions and daily when needed.
One foundation, a reusable Fusion layer
Salt → Fusion → widgets
I built tokens, components, patterns and accessibility layers on Salt: data tables, chart frames, filter bars and widget shells. Gaps went back upstream. Other Fusion teams reused the same components and patterns.
Many cubes, familiar views
FactSet supplies performance, attribution and risk data. The same widgets serve different cubes and permission levels. People configure their own dashboard pages; entitlements control what they see. Import and export run through FactSet.
I kept Fusion on Salt so it could follow the firm's updates, and contributed missing patterns back. The diagram describes the original product; the public rebuild is not connected to FactSet or entitlement services.
06 Outcome
Shipped,adopted,andopenedtoclients.
Reviewed
I worked closely with an ADA specialist on a specific flow and used developer tools to run accessibility checks. This describes the flow reviewed, not a product-wide audit or WCAG certification.
Adopted
Widget and filtering patterns reused across other Fusion modules.
Phase 2
Opened the product to external clients.
Accessibility and responsiveness
Accessibility was a review step.
An accessibility specialist sat in every review. Anything that failed went back before it reached engineering.
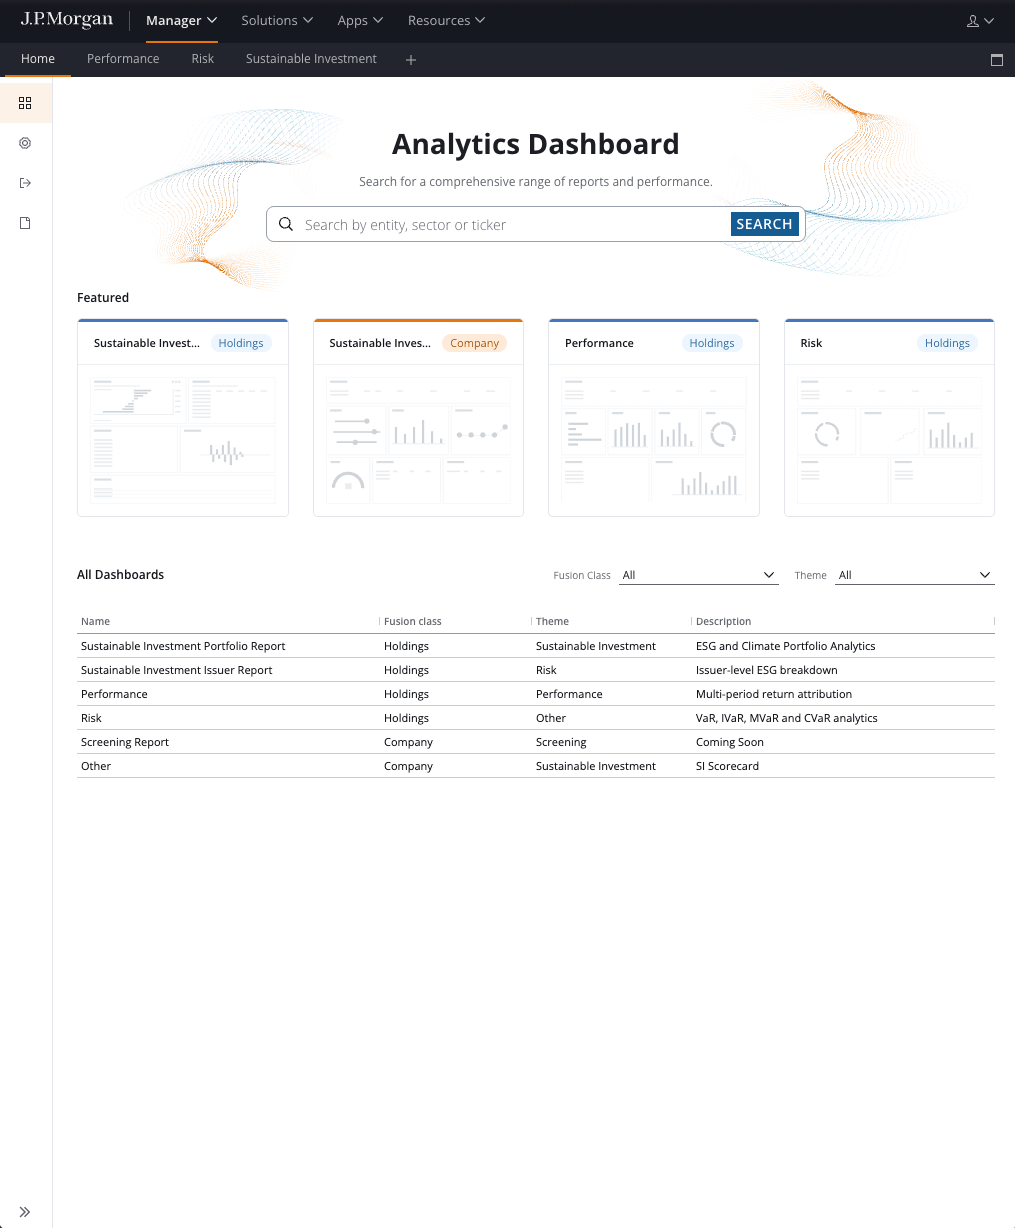
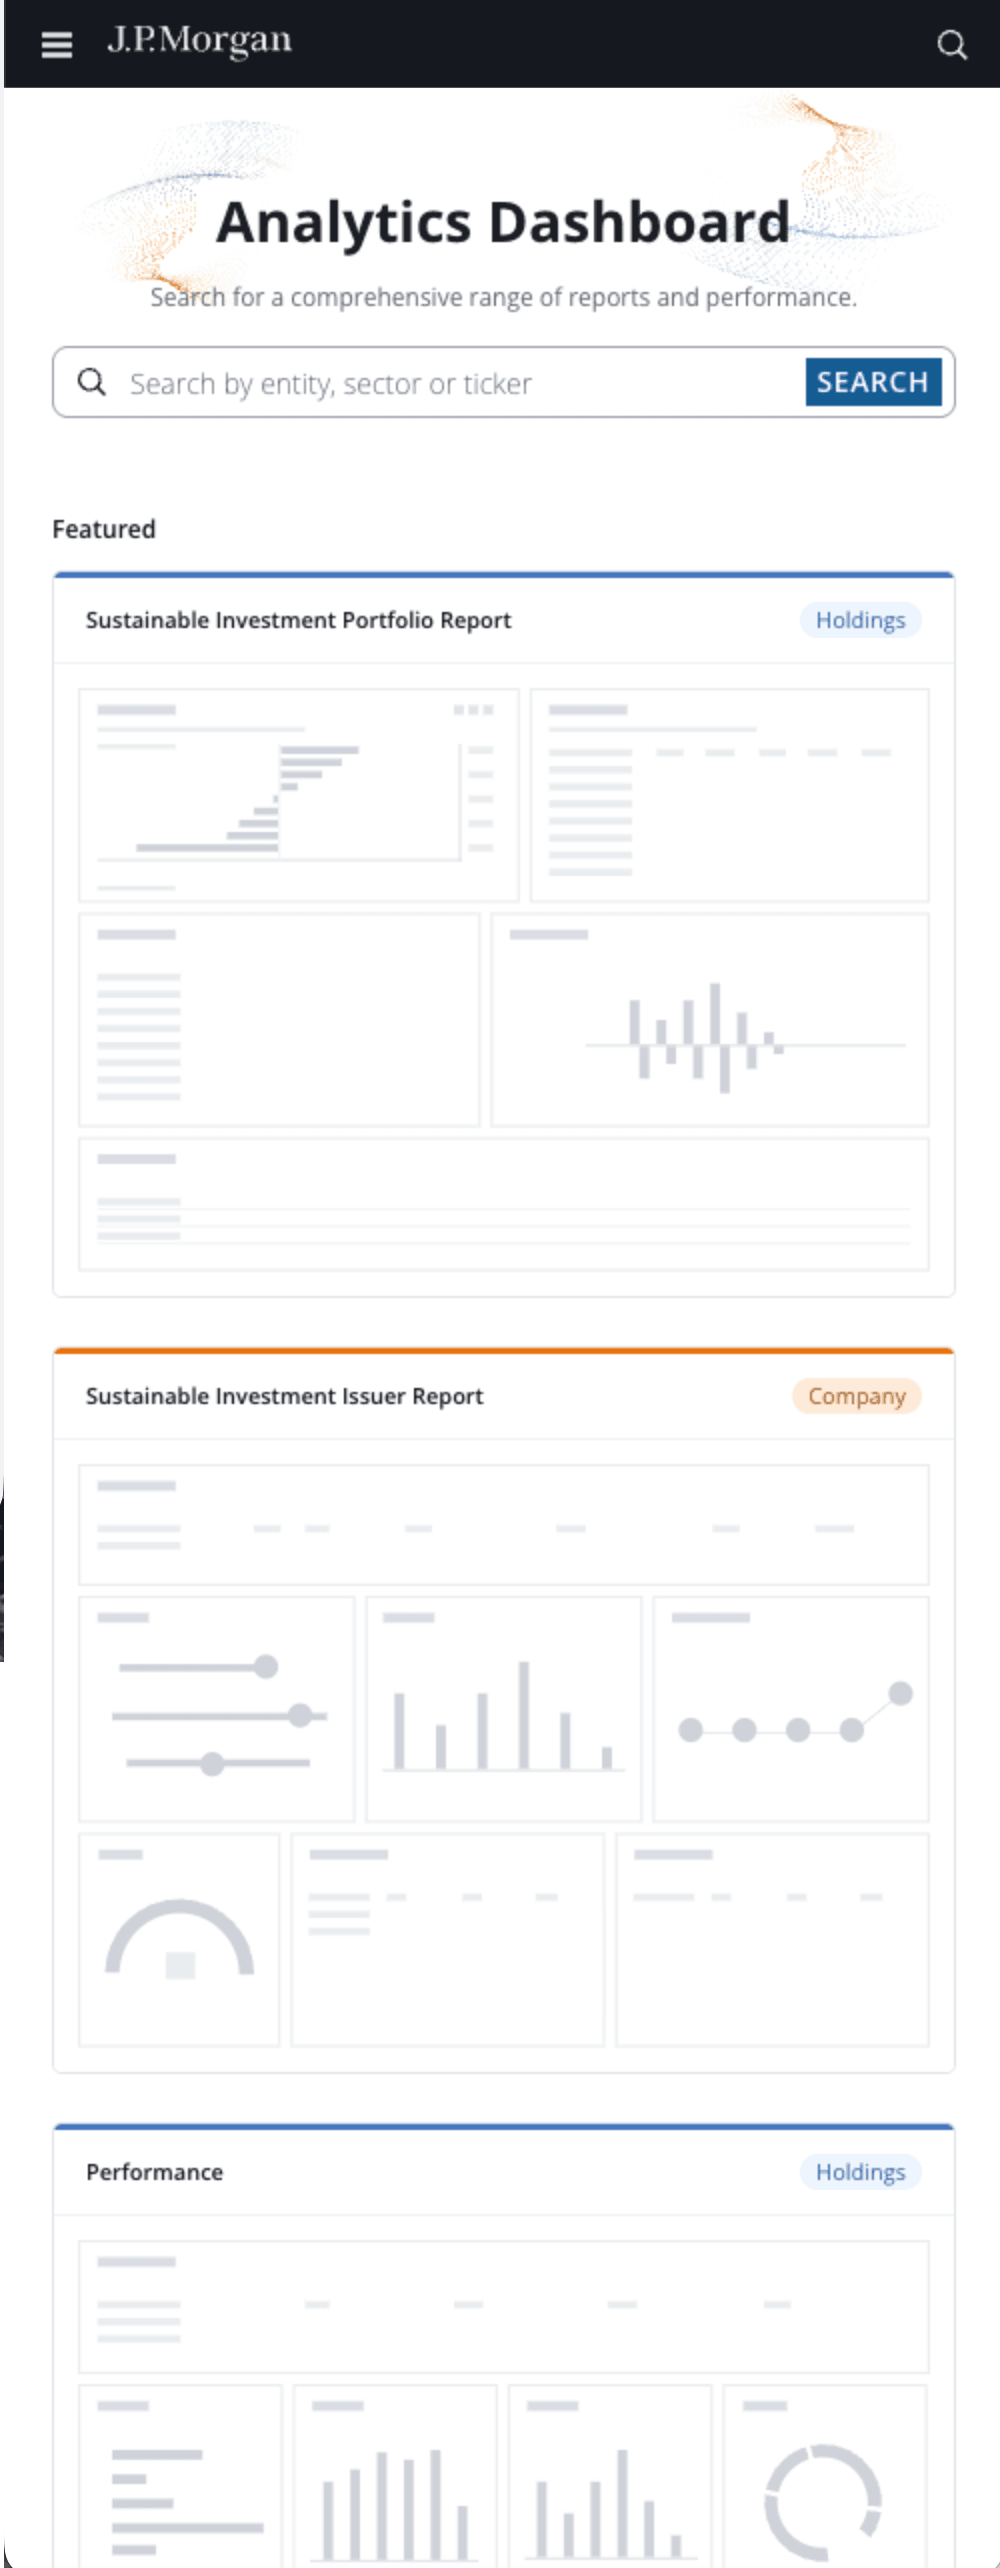
Across screen sizes
The rebuild's catalogue reflows at 820px and at 390px. These captures show the catalogue. The dense analytics workspaces are desktop first, and I say so.