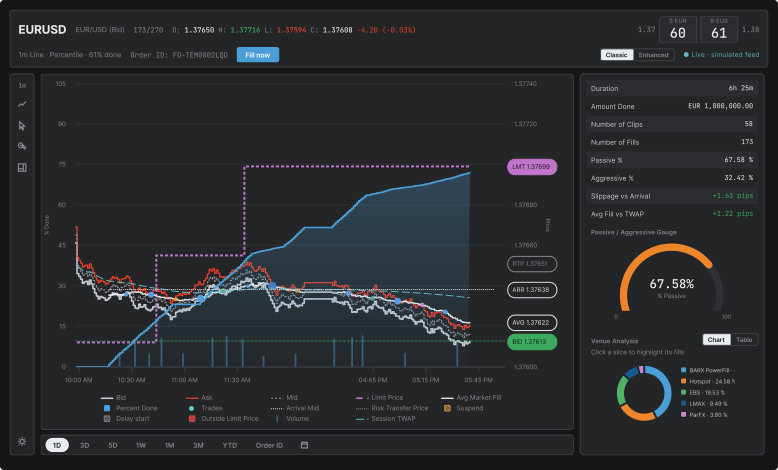
A trader works a large FX order over hours and keeps deciding whether to step in or leave it. The desk did that across a static chart, five spreadsheets and a separate execution tool.
Role · Lead designer, one of oneTeam · ~20 engineers, business, charting vendorStatus · Beta with internal usersPlatform · Web, light and darkLive · My public rebuild (opens in new tab) →
The sales and trading desk, and the institutional clients executing through the same platform with different entitlements.
Where we started
One static Execution Over Time chart from the desk. Five spreadsheets covering trades, market data per order, price limit logs and reference prices. A twelve-item wishlist. No design, no interaction model, no visual language.
Project status
In beta with internal users at Barclays. Under NDA, so the screens here are my public rebuild and Figma designs, using sample data and based on the production spec.
A trader will tolerate density because power is worth the learning curve. So the problem is hierarchy under pressure, not simplification.
Five spreadsheets, read line by line
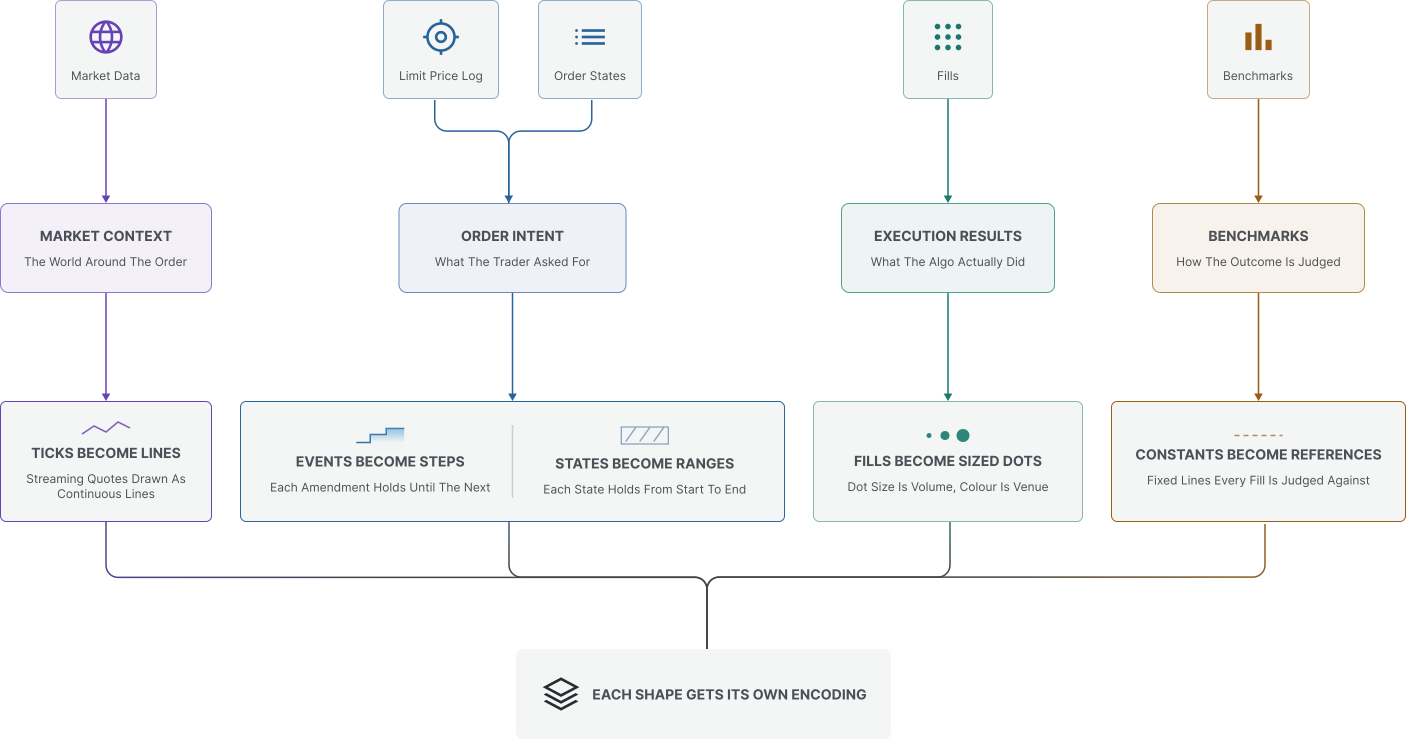
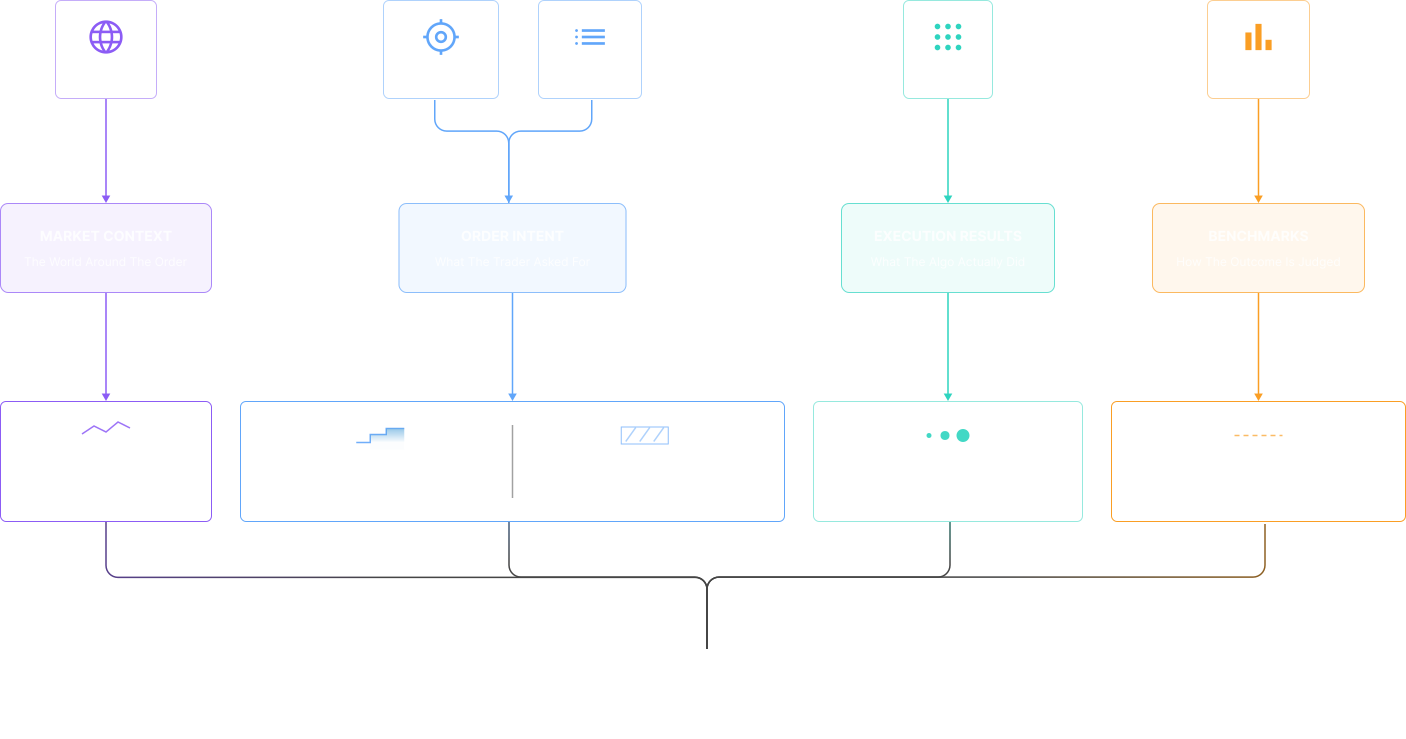
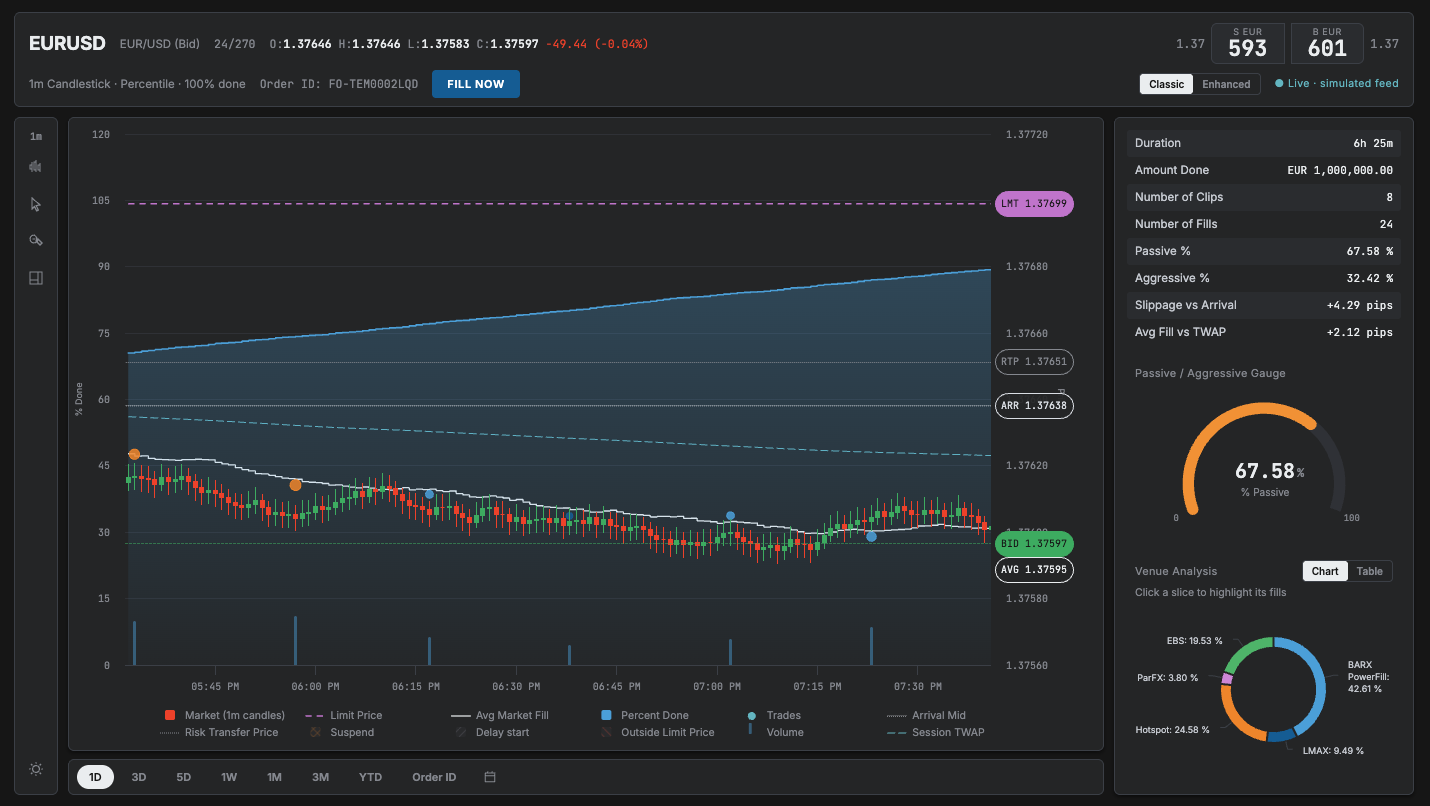
Fills, market data, limit price changes, arrival price, risk transfer price. I grouped them into four kinds of data and that grouping became the layers of the chart. Every mark maps to a data type. Nothing is decorative.
The limit price log was the clue
Orders were being changed mid-flight, several times each. So repricing is a core action, not an edge case, and it had to live on the chart.
Watching people decide
I observed traders on the desk to understand when they monitor an order and when they intervene. Their question is whether they are ahead of the market or behind it. That is the first thing the screen answers.
User personas
My three design personas: execution, desk oversight and algo tuning. Illustrations, not photographs of research participants.
Dana Chen
Senior Execution Trader
Buy-side FX desk
“
I need one glance to know whether my order needs me, or whether I’d just be adding noise.
Context
Works a large FX order through the session, watching price and progress to decide when to intervene.
In this app
Benchmarks + pinned tooltip
Reprice & pill-drag staging
Venue cross-filter
Goals
Beat arrival mid without burning the spread
Keep the passive ratio high yet on schedule
Catch venue toxicity before it costs pips
Pain points
TCA lands after the damage is done
Alerts fire without market context
Juggling EMS blotter, charts and chat
Marcus Webb
Head of Trading
Desk oversight
“
Best execution isn’t a report, it’s something I defend order by order.
Context
Oversees the trading desk and reviews execution quality across orders and venues.
In this app
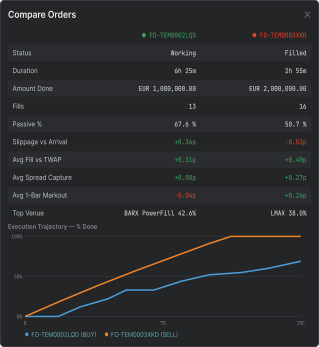
Compare orders
Venue analysis chart + table
Passive / aggressive gauge
Goals
Defend best execution order by order
Compare sibling orders on one canvas
Spot venue-mix drift across the desk
Pain points
Evidence scattered across tools
Slippage numbers without a narrative
Static end-of-day reporting
Priya Nair
Execution Quant
Algo tuning
“
Give me the complete series and I’ll tell you if the pacing is wrong.
Context
Studies fill placement and pacing to tune how an execution algorithm behaves.
In this app
Bid/ask/mid study inputs (specified)
Interval regrouping
Table view with CSV export
Goals
Validate pacing against session TWAP
Study fill placement vs mid by venue
Tune passive / aggressive thresholds
Pain points
Downsampling hides microstructure
Studies polluted by partial series
User journey
Dana Chen · Senior Execution Trader · Buy-side FX desk, London · EURUSD, 1M sell, one session
Persona
Dana Chen
Senior Execution Trader
Buy-side FX desk
Scenario
Dana is working a 1M EURUSD sell across the London session. The algo slices it into child orders while she supervises a book of tickets at once. She starts from benchmarks she trusts, arrival mid and session TWAP, and steps in only when the canvas says the order needs her.
Goal
Finish inside the benchmarks, stay mostly passive, and defend the execution afterwards.
01Pre-trade
Dana reviews liquidity for the session and sets the order limit. Arrival mid anchors the execution; session TWAP provides an evolving market benchmark.
Design response
Order ticket with limit and notional
Fixed arrival mid and evolving session TWAP
What the system does
The ticket carries the limit and notional. Arrival mid stays fixed; session TWAP updates as market prices arrive.
02Staging the order
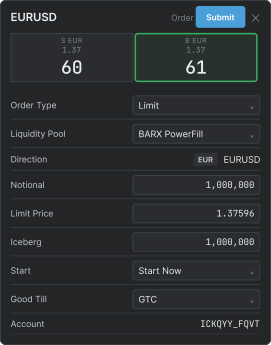
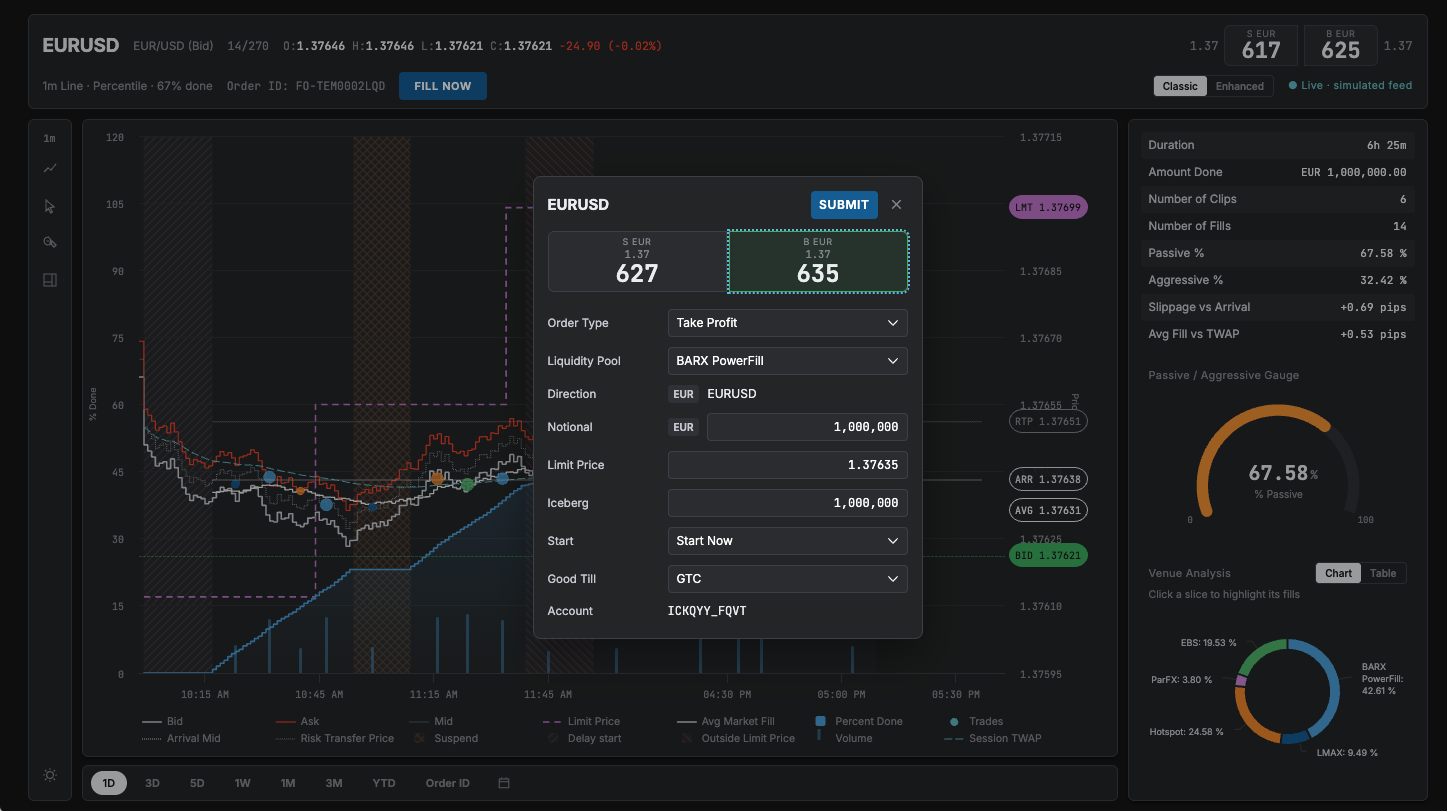
She stages the order straight from the chart, dragging the BID pill to a level and reviewing the pre-filled ticket before submitting.
Design response
Pill-drag staging
Pre-filled ticket, one check and go
What the system does
Dragging the BID pill stages the order at that level and pre-fills the ticket. Nothing is sent until she confirms.
While the order is working
Watch progress against schedule and fills against the market.
On schedule and inside the benchmarks
03Working passively
The algo works. Dana watches percent done against schedule, fills against the market, and the venue mix, without touching anything.
Design response
Canvas with pinned tooltip
Passive gauge and venue doughnut
Keep working and stay passive.
When the order needs attention
04Intervention
When the market drifts or a hatched band comes on, she acts from the chart: repricing the limit, flipping aggressive, or excluding a venue.
Design response
Reprice
Venue cross-filter
Reprice, fill now or filter venues, then return to watching the canvas.
After the order
05Post-trade review
Done. Dana compares the order against its sibling, exports the fills, and writes the best-ex note while the context is fresh.
Internal traders and external clients use the same system with different entitlements. I had to support both on old technology without a second codebase.
A fixed engine
The charting vendor's capabilities shaped the options. Some ideas were possible, some were not, and some were possible but wrong. I treated those limits as design inputs.
Confirm, then record
In the original order-changing flow, I kept confirmation and an audit trail beside the action. Compliance stayed inside the workflow.
Ship, then repair the foundation
A light-theme tidy-up exposed hardcoded colours in the code, tokens and naming. I costed two options with product and engineering. We shipped features first, then phased the fix in the background, starting with the simple, single-themed blotter.
FX is in beta. Confirmation and audit describe the original Barclays specification; my public rebuild does not implement the audit backend. The illustrations use schematic, non-client data.
Watch, assess, step in. Every branch lands on a screen. Two questions, one screen. How far along is my order, and am I getting a good price. Show them apart and the trader flicks between charts under pressure. Mash them together and it's noise. The working principle: readable in two seconds, actionable in one click.
Decision map
Three connected decisions: what the trader sees, where they act, and which data a study can trust. The evidence differs for each call.
Reading → acting
Combining progress and price puts the decision on one canvas. Repricing belongs beside that context, with a ticket before the order changes.
Acting → trusting
More controls do not justify unreliable analytics. Study sources need their own data-quality boundary.
Decision loop · when to step in
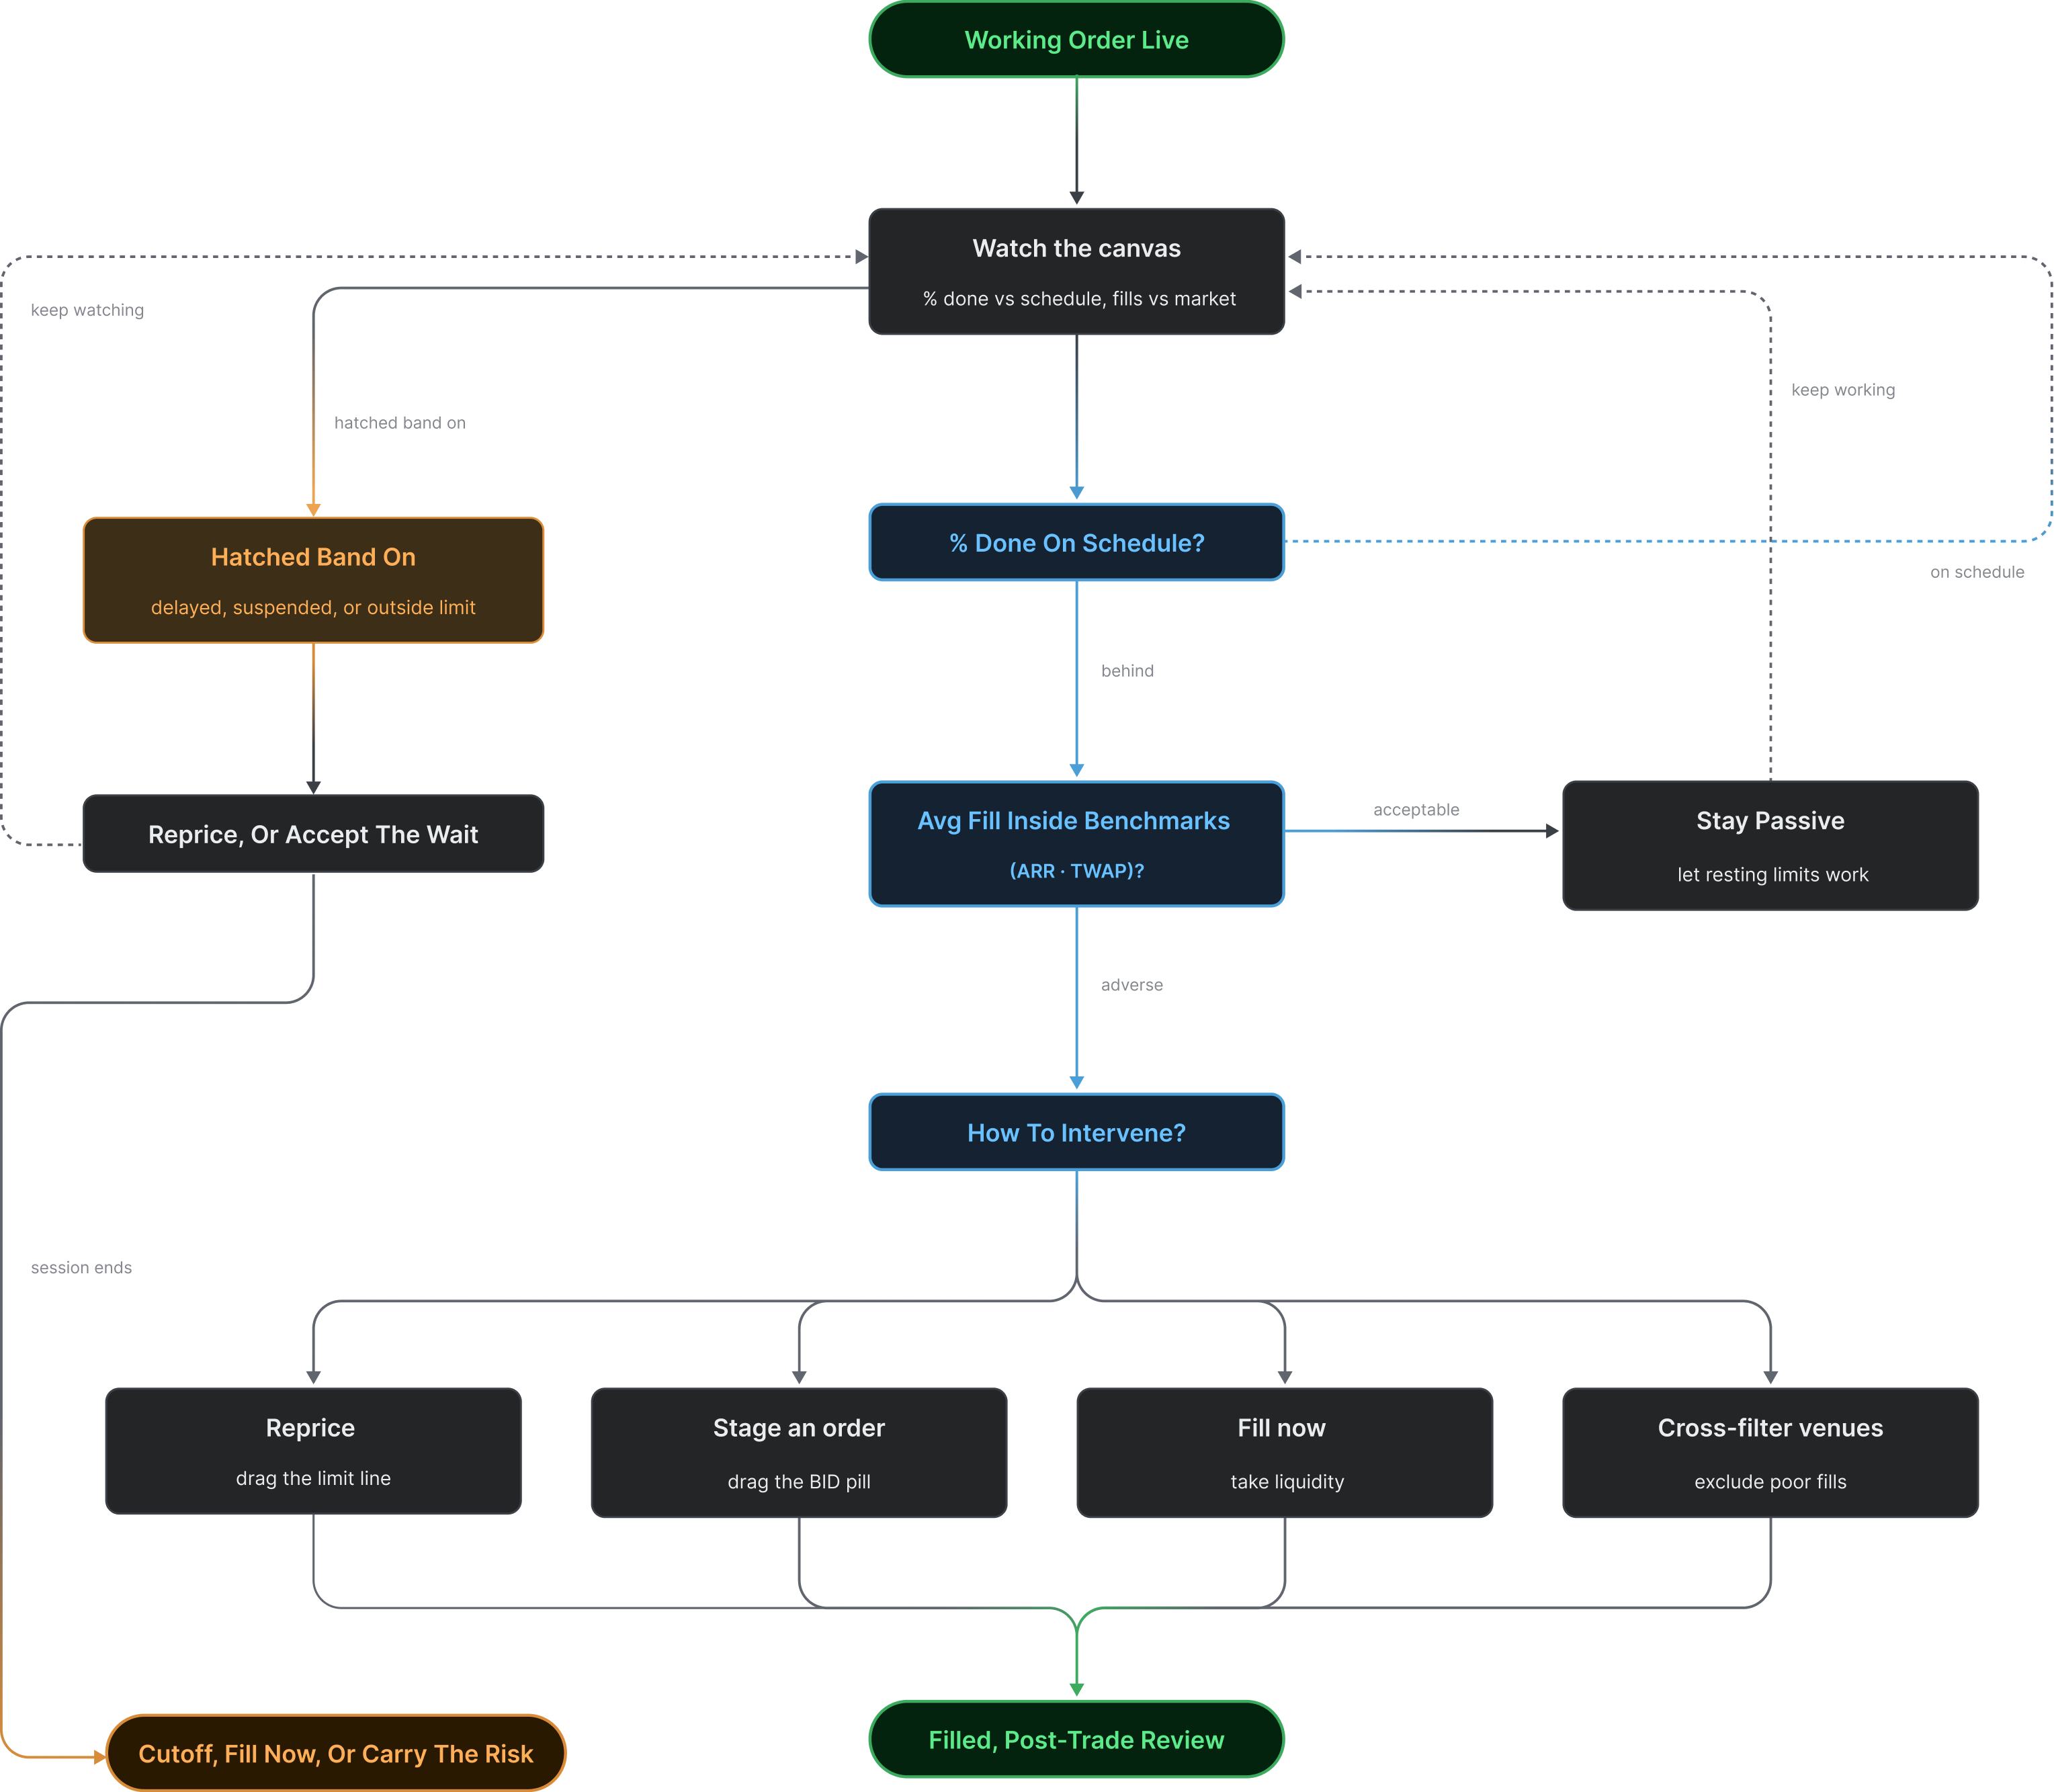
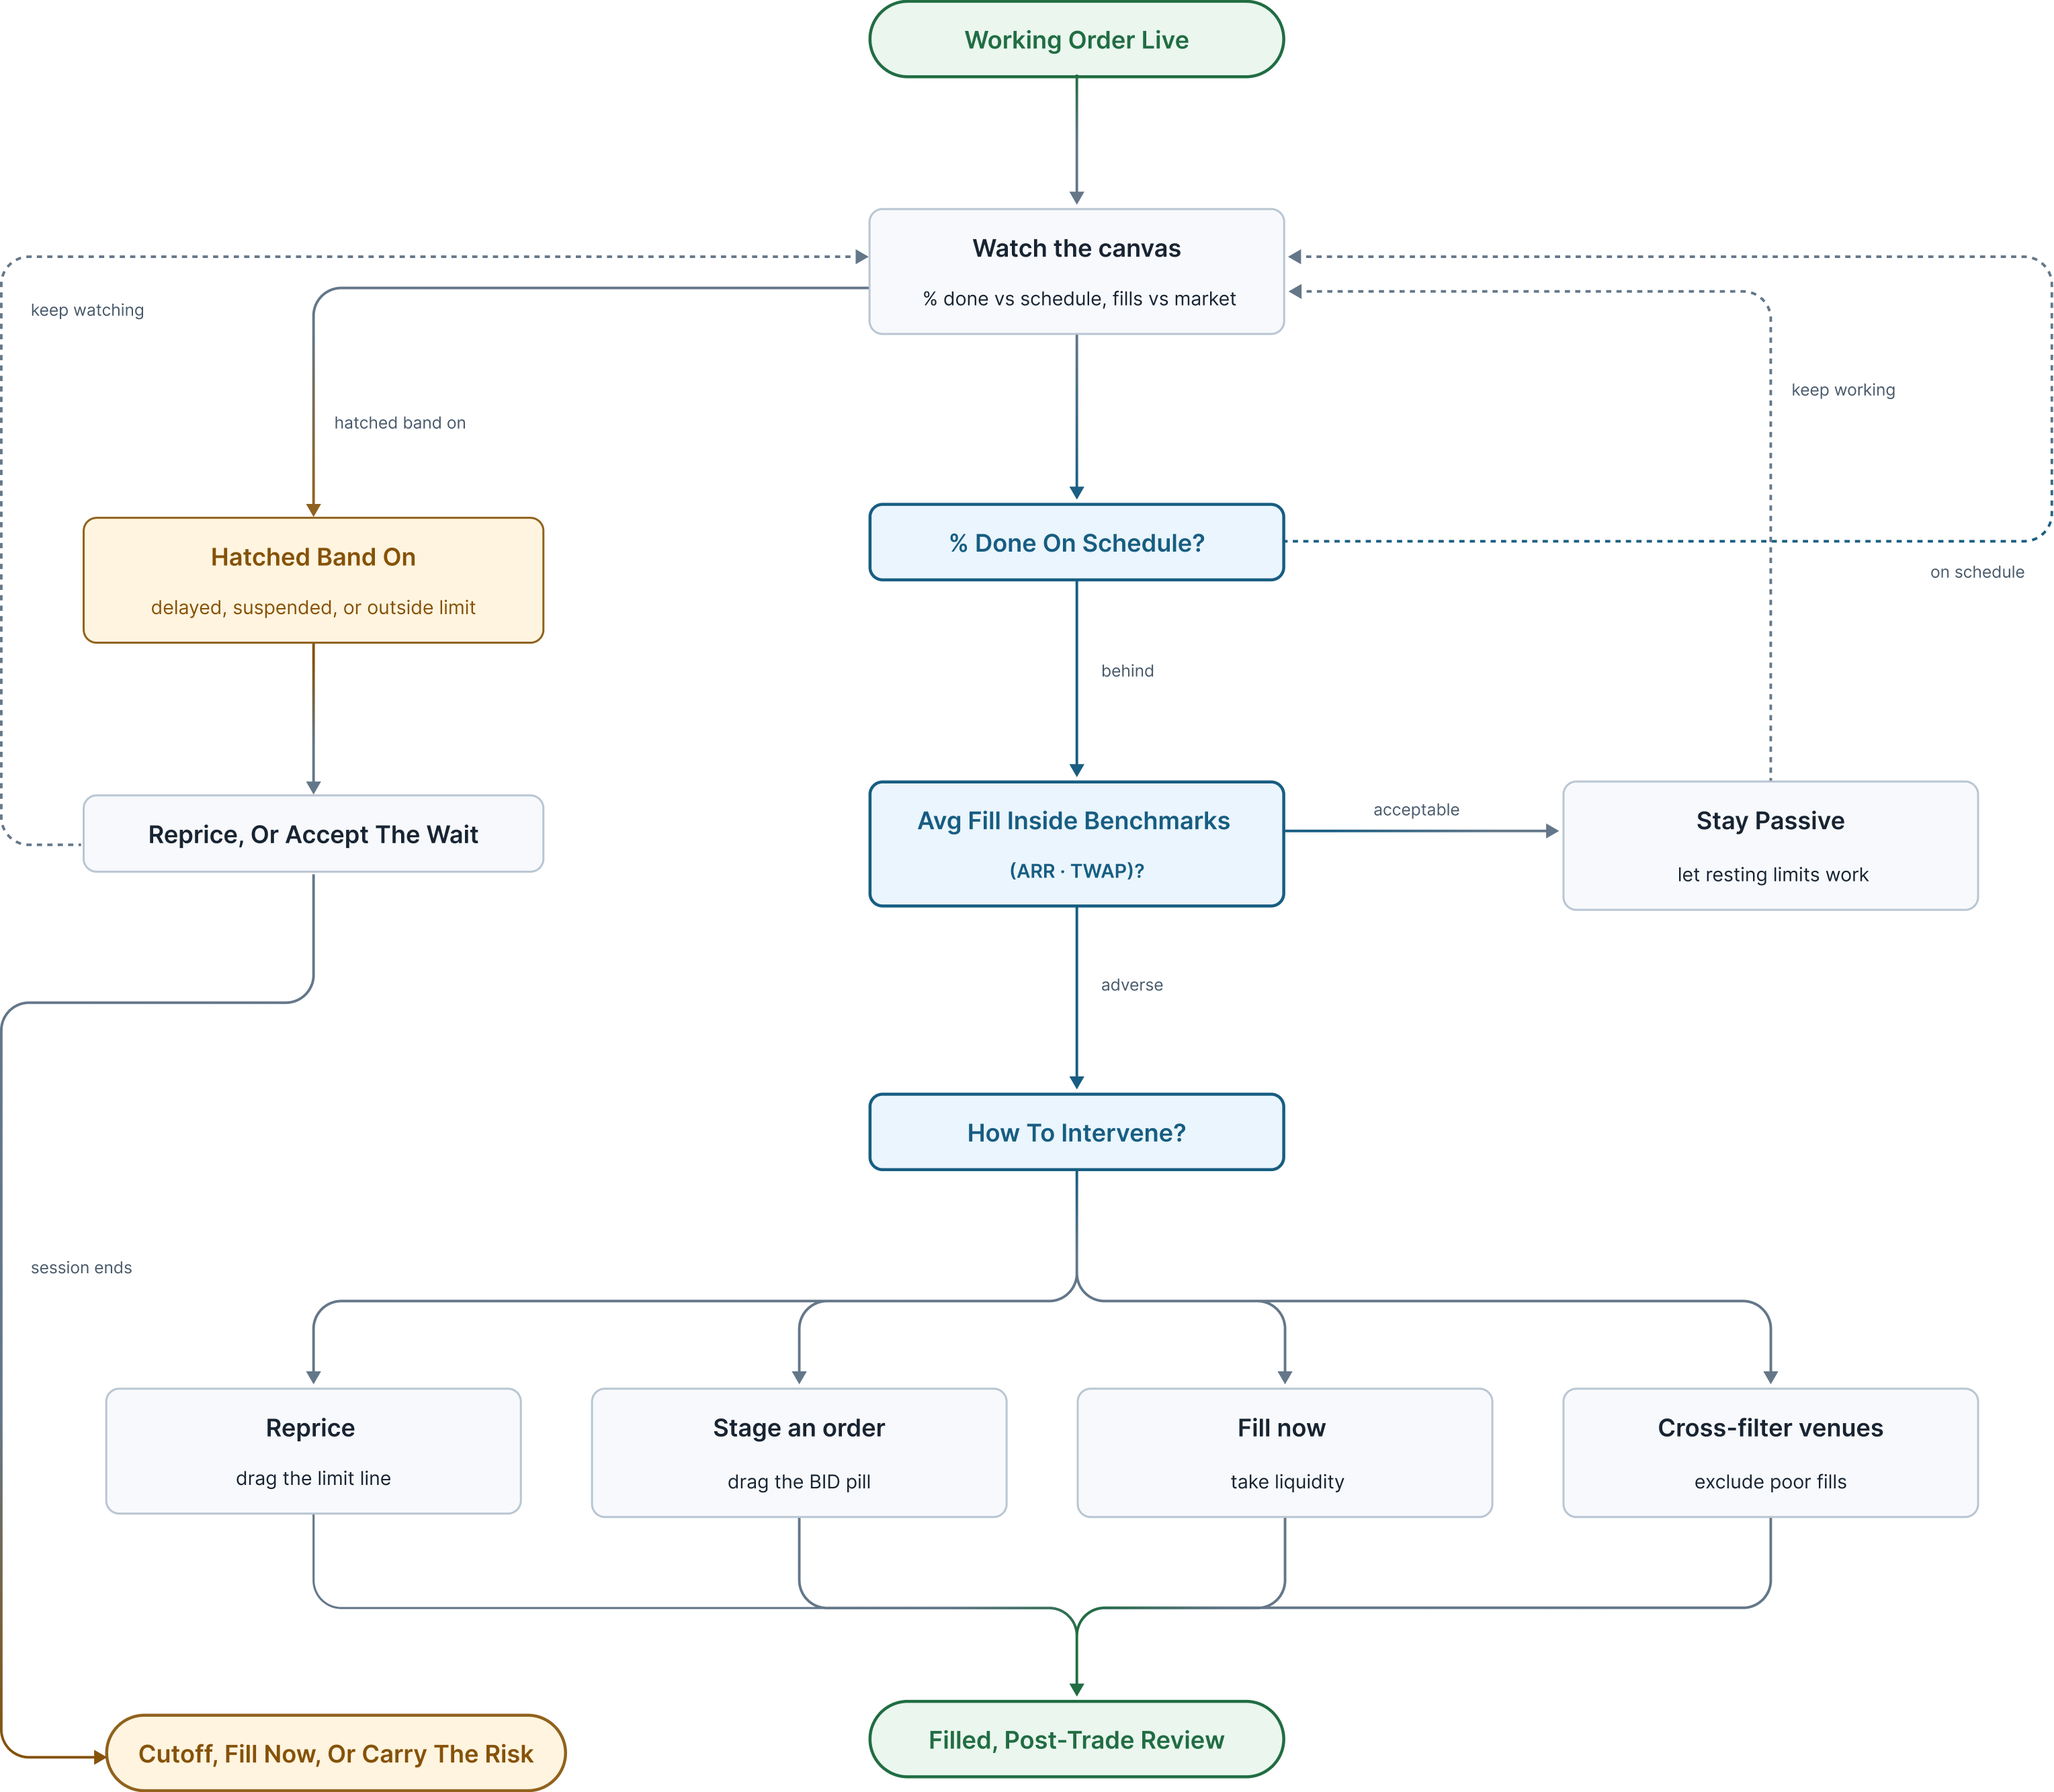
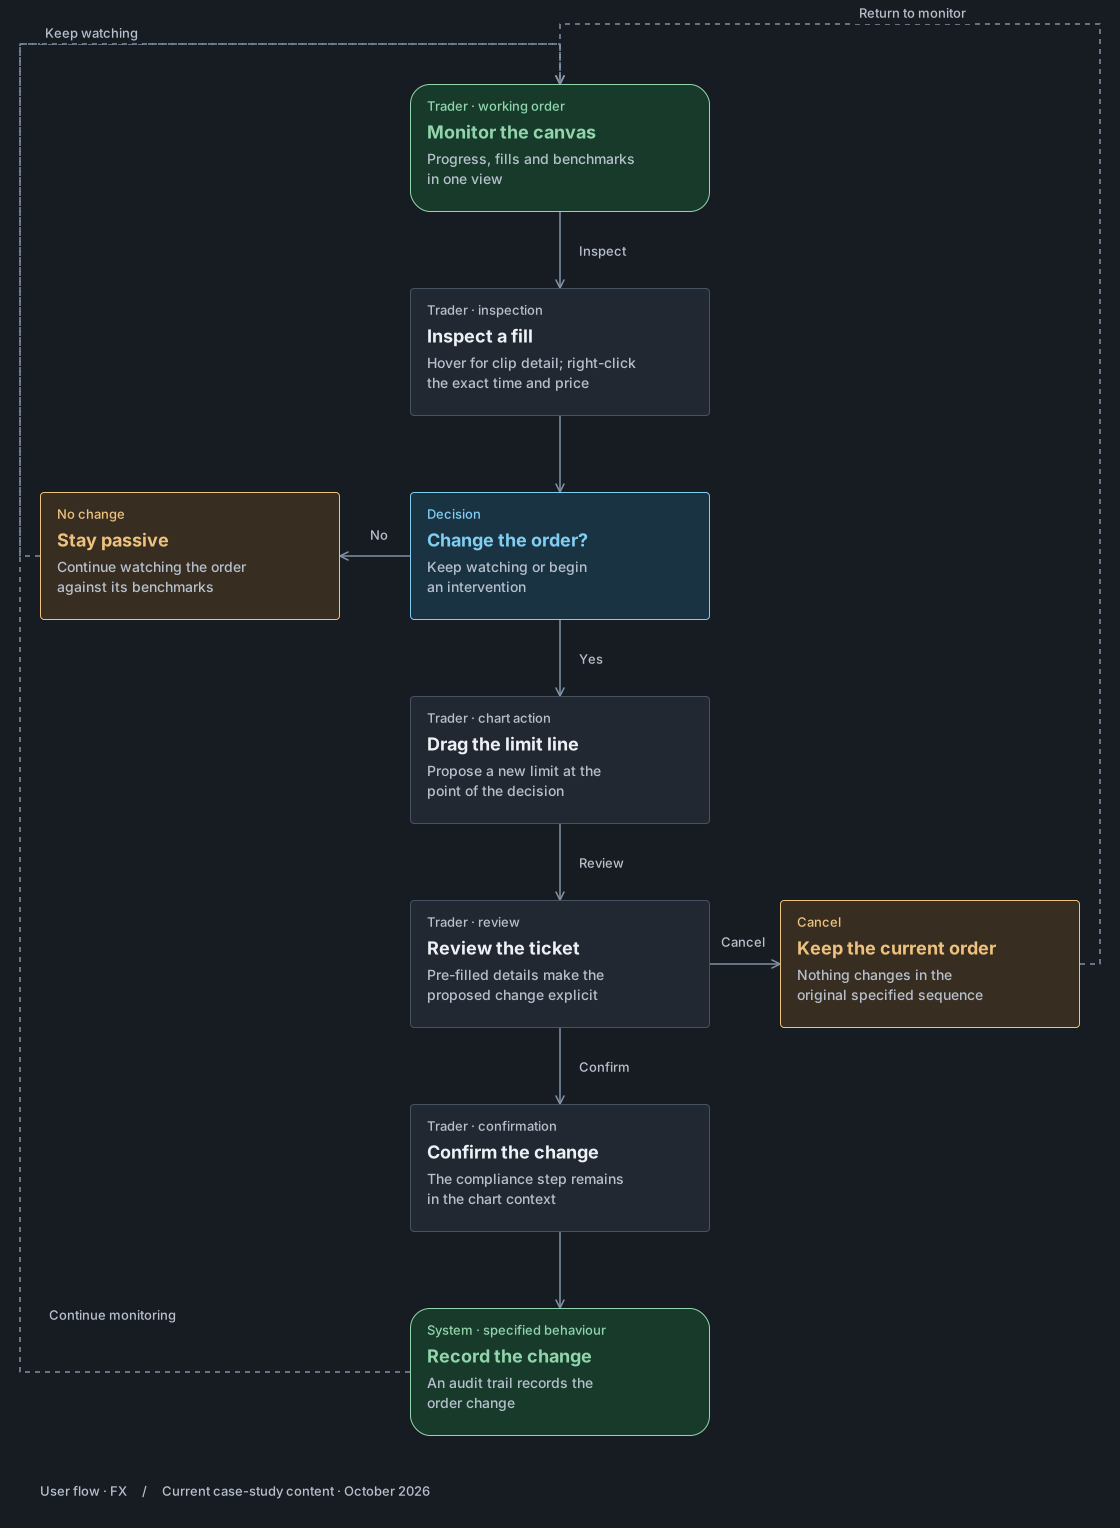
The original decision loop shows when the trader watches, waits or intervenes. The design alternatives and evidence are set out below.
The branches in the original loop
Working Order Live → Watch the canvas. Percent done against schedule, fills against the market.
Percent done on schedule? On schedule → watch the canvas. Behind → is the average fill inside the benchmarks, arrival and TWAP?
Acceptable → stay passive: let resting limits work, keep working, watch the canvas.
Adverse → how to intervene? Reprice by dragging the limit line. Stage an order by dragging the BID pill. Fill now and take liquidity. Cross-filter venues to exclude poor fills. Each leads to Filled, Post-trade review.
Hatched band on: delayed, suspended, or outside limit → reprice, or accept the wait → keep watching. Session ends → cut off, fill now, or carry the risk.
Specified for the Barclays beta
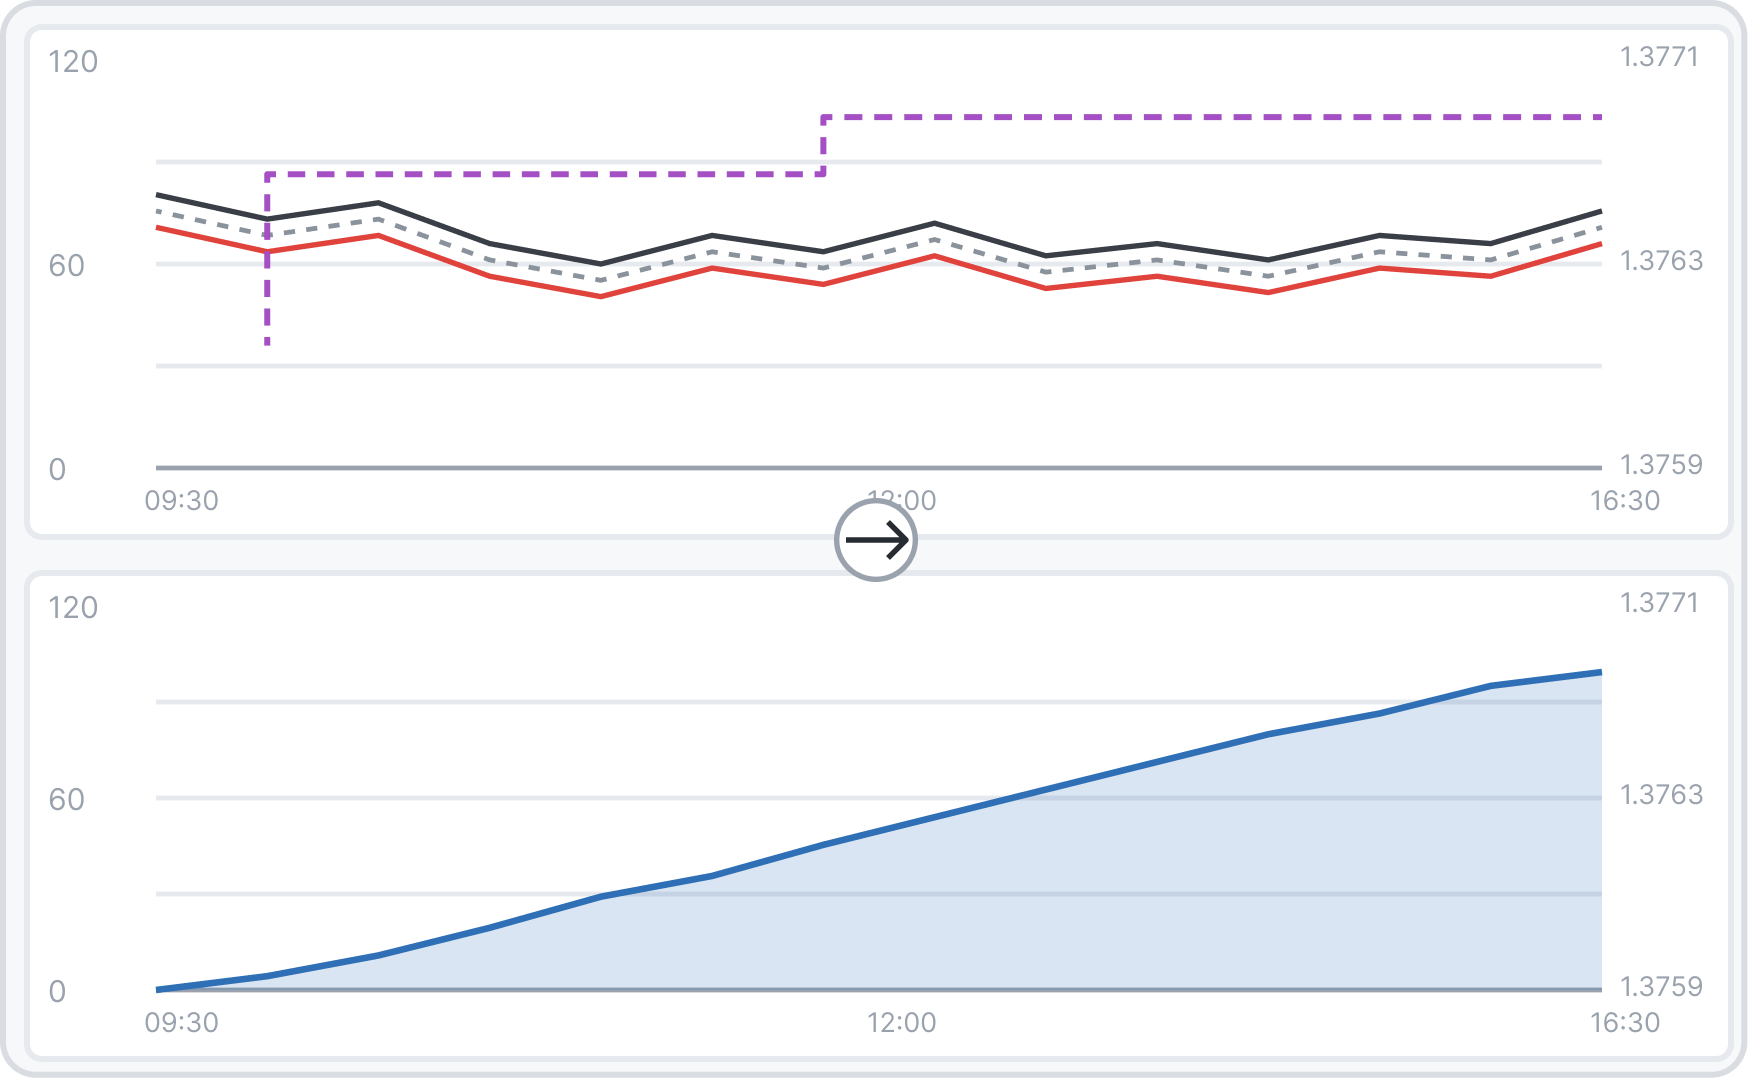
01Progress and price on one canvas, not two panels
How can a trader compare progress with price without losing the moment?
The trader needs to read the market and the order together during live execution. Separating the views makes that comparison a repeated task.
I chose
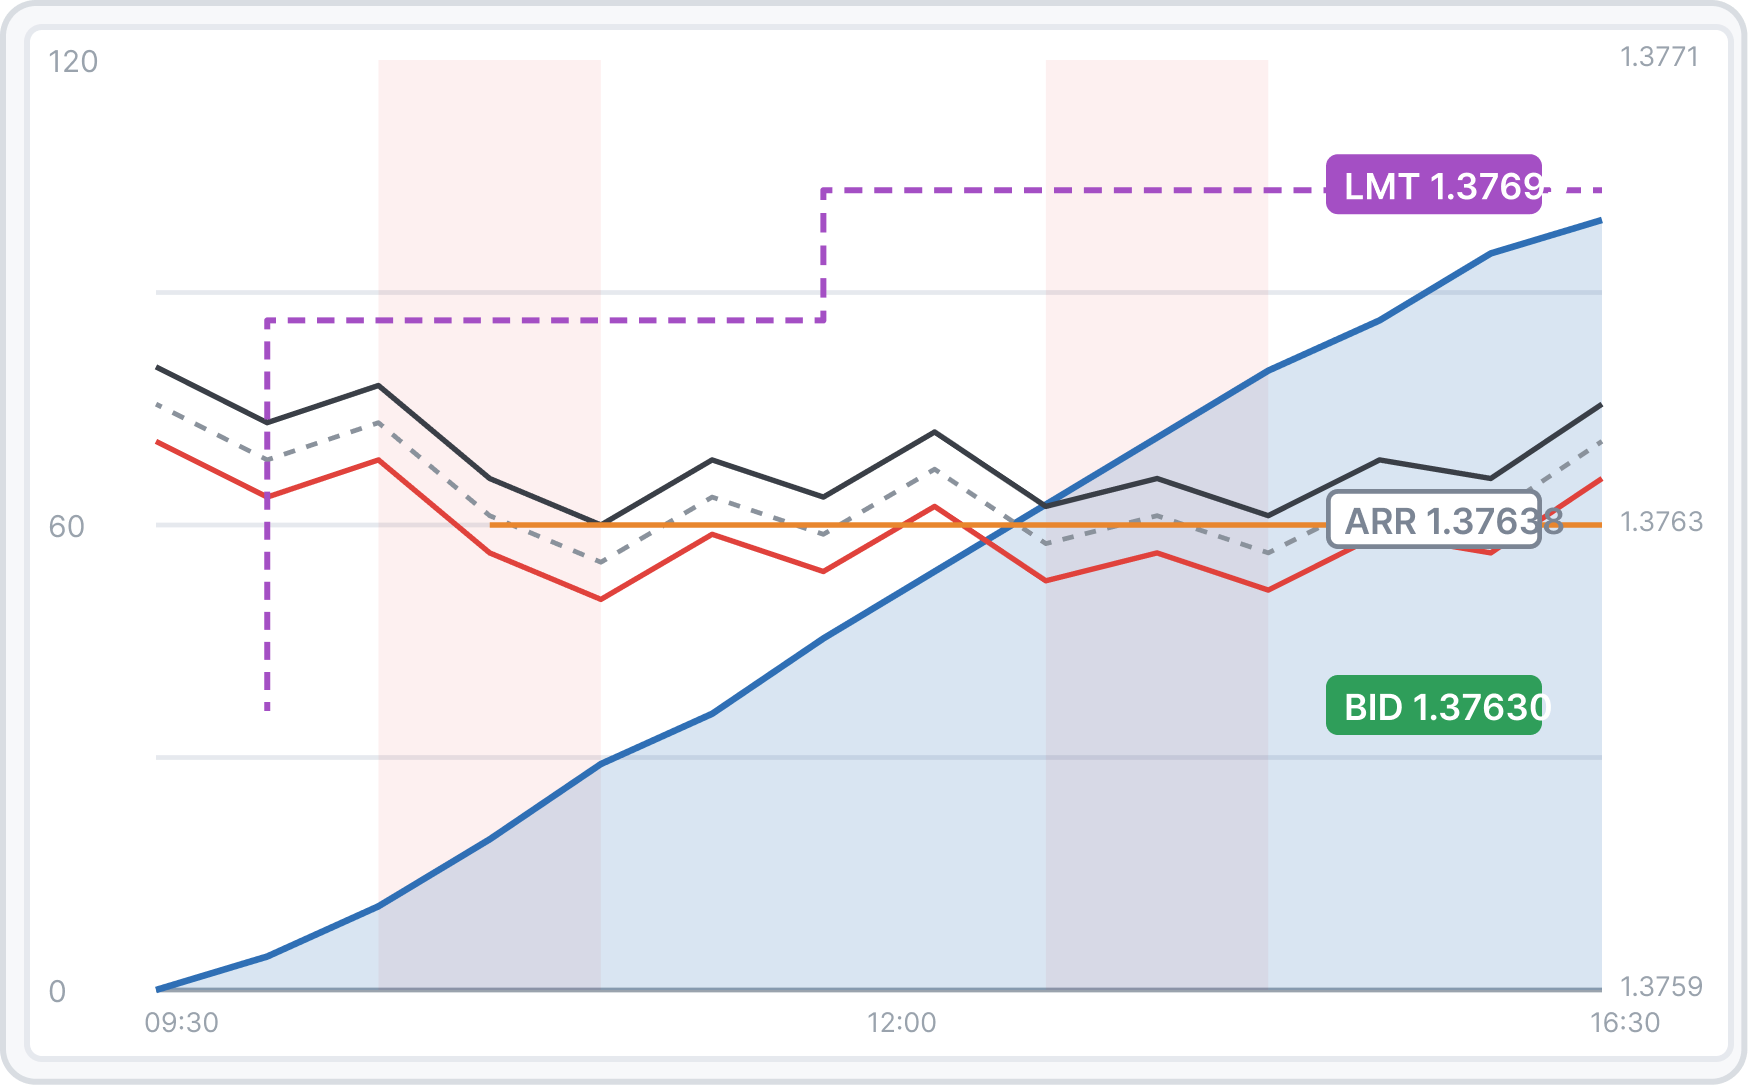
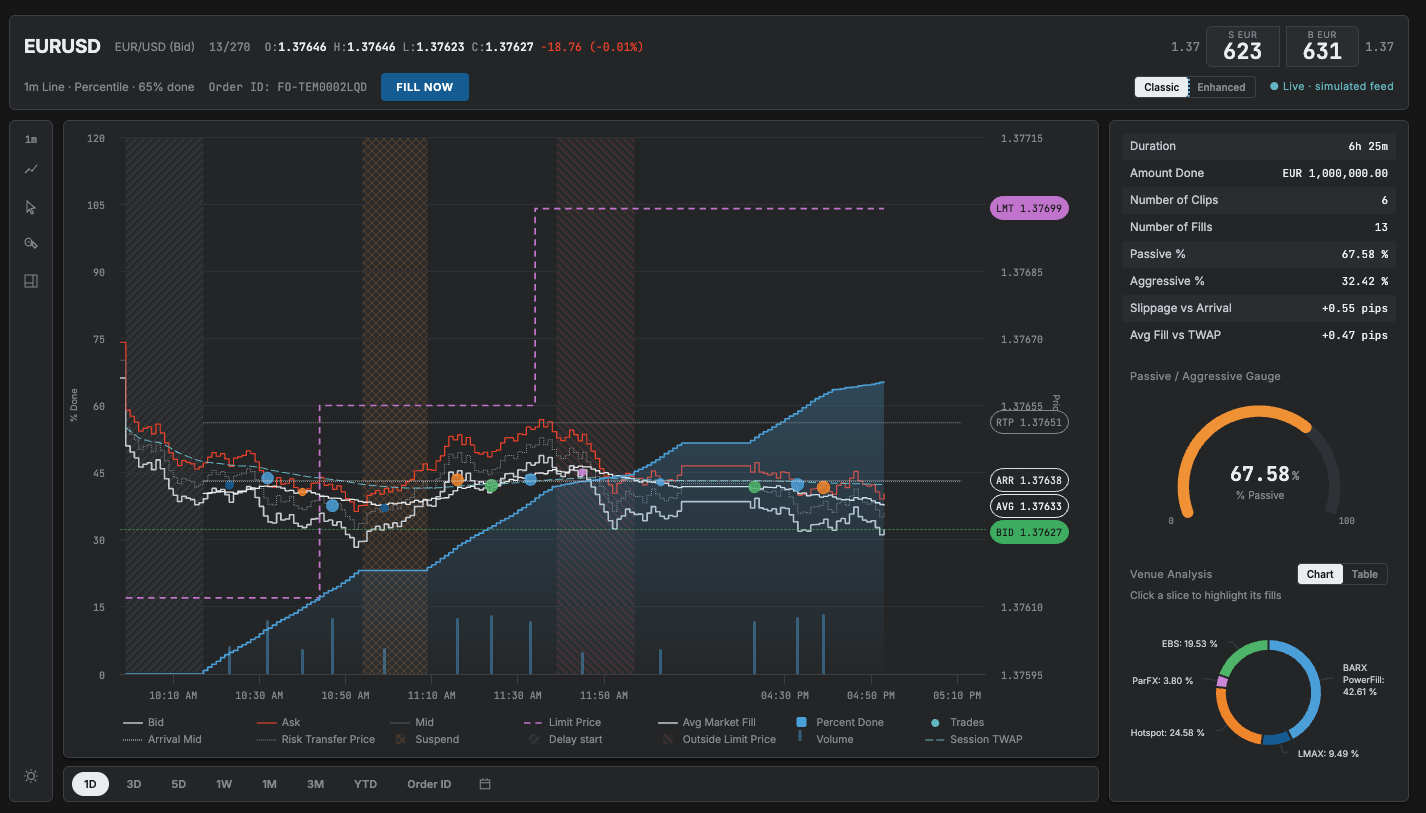
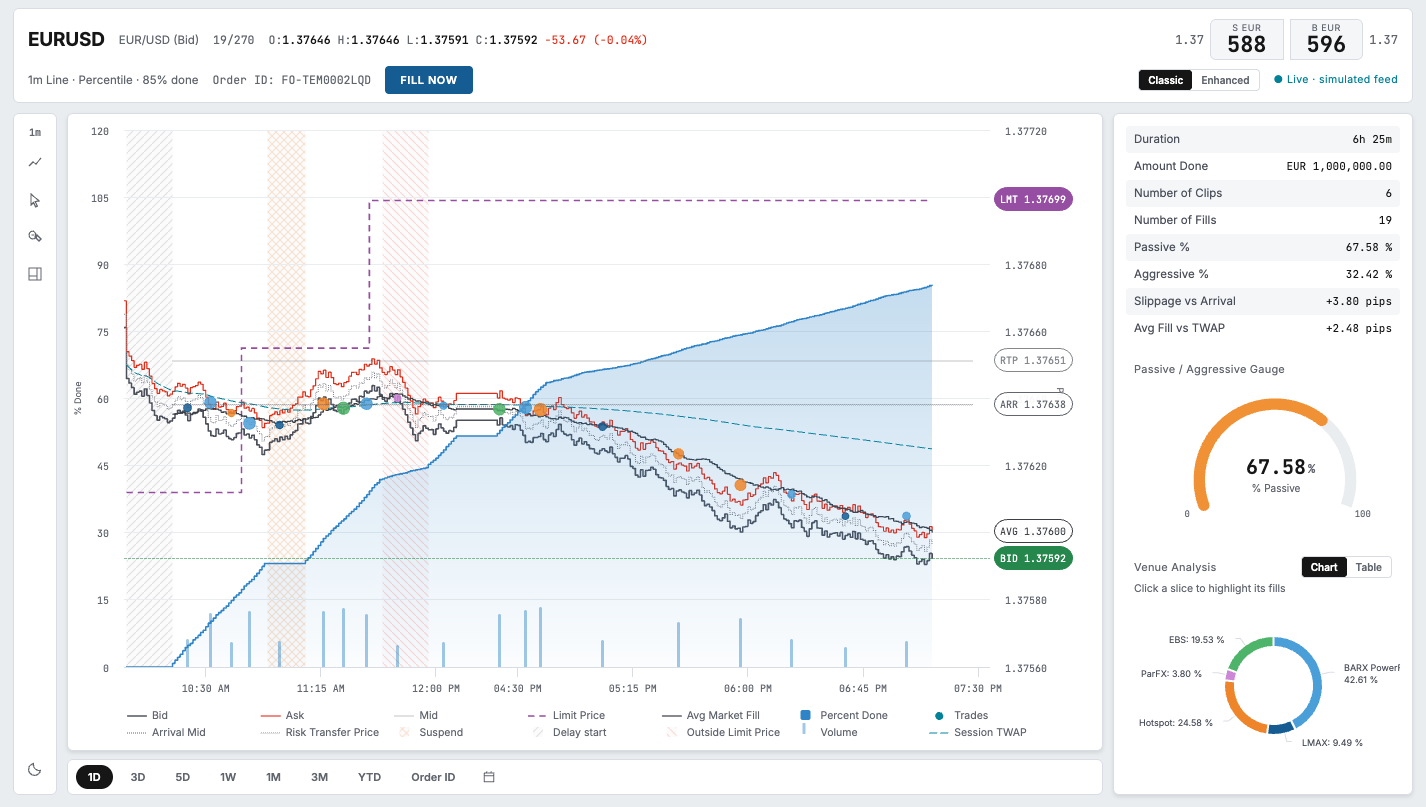
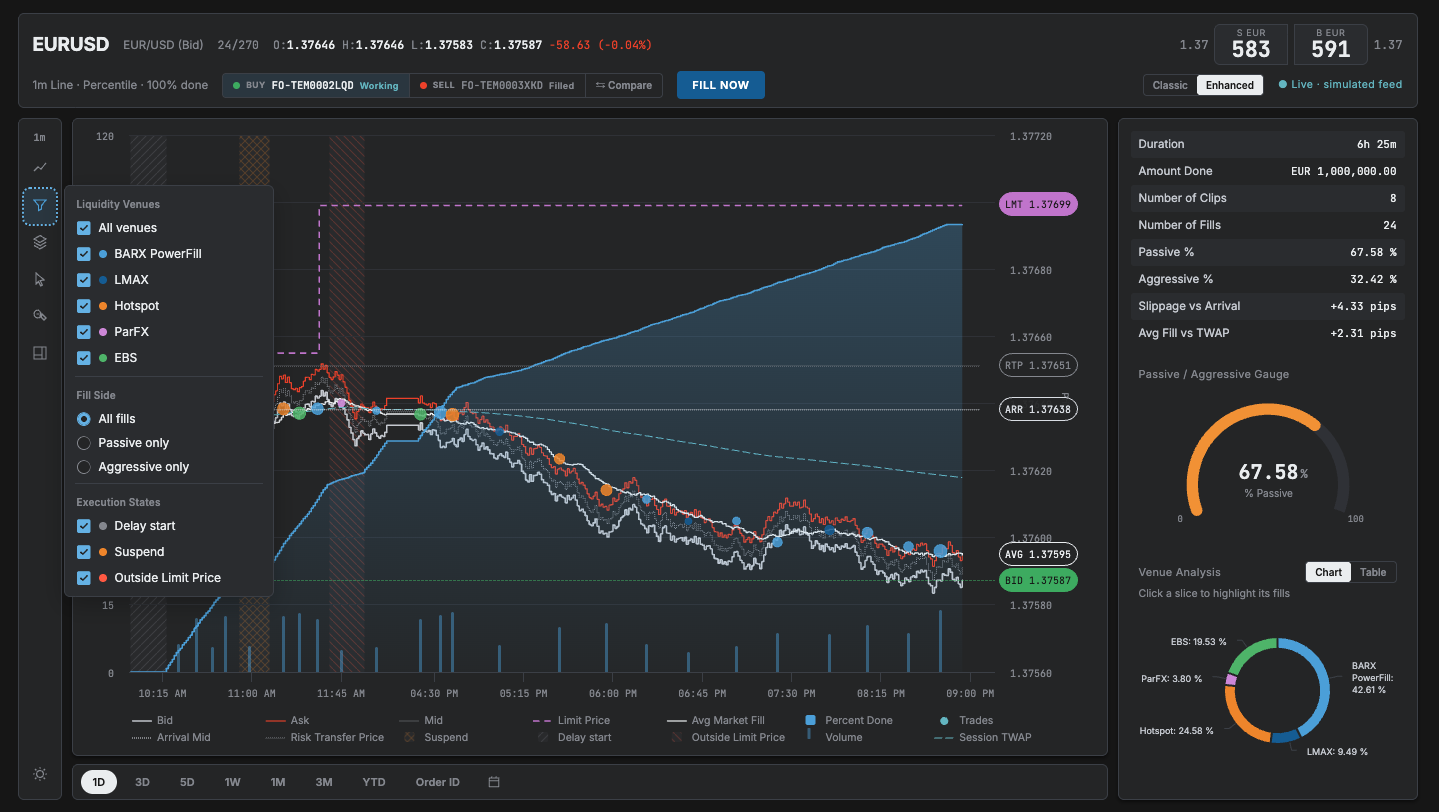
One canvas with a dual axis
Keep price and progress in the same field of view; use distinct axes and hierarchy to handle the density.
Alternative
Two linked panels
Separate the two measures into cleaner panels, but require the trader to move between them.
Why I chose it
I explored two linked panels and one combined chart. I chose the combined canvas to keep price and progress in the same field of view, with separate axes and careful hierarchy.
What it cost
A denser screen that needed careful hierarchy.
What informed the decision
I observed traders during live trading and asked what they watched, waited for and acted on. I used that to design the combined canvas. I do not have a measured comparison of the two layouts.
Specified with a confirmation step
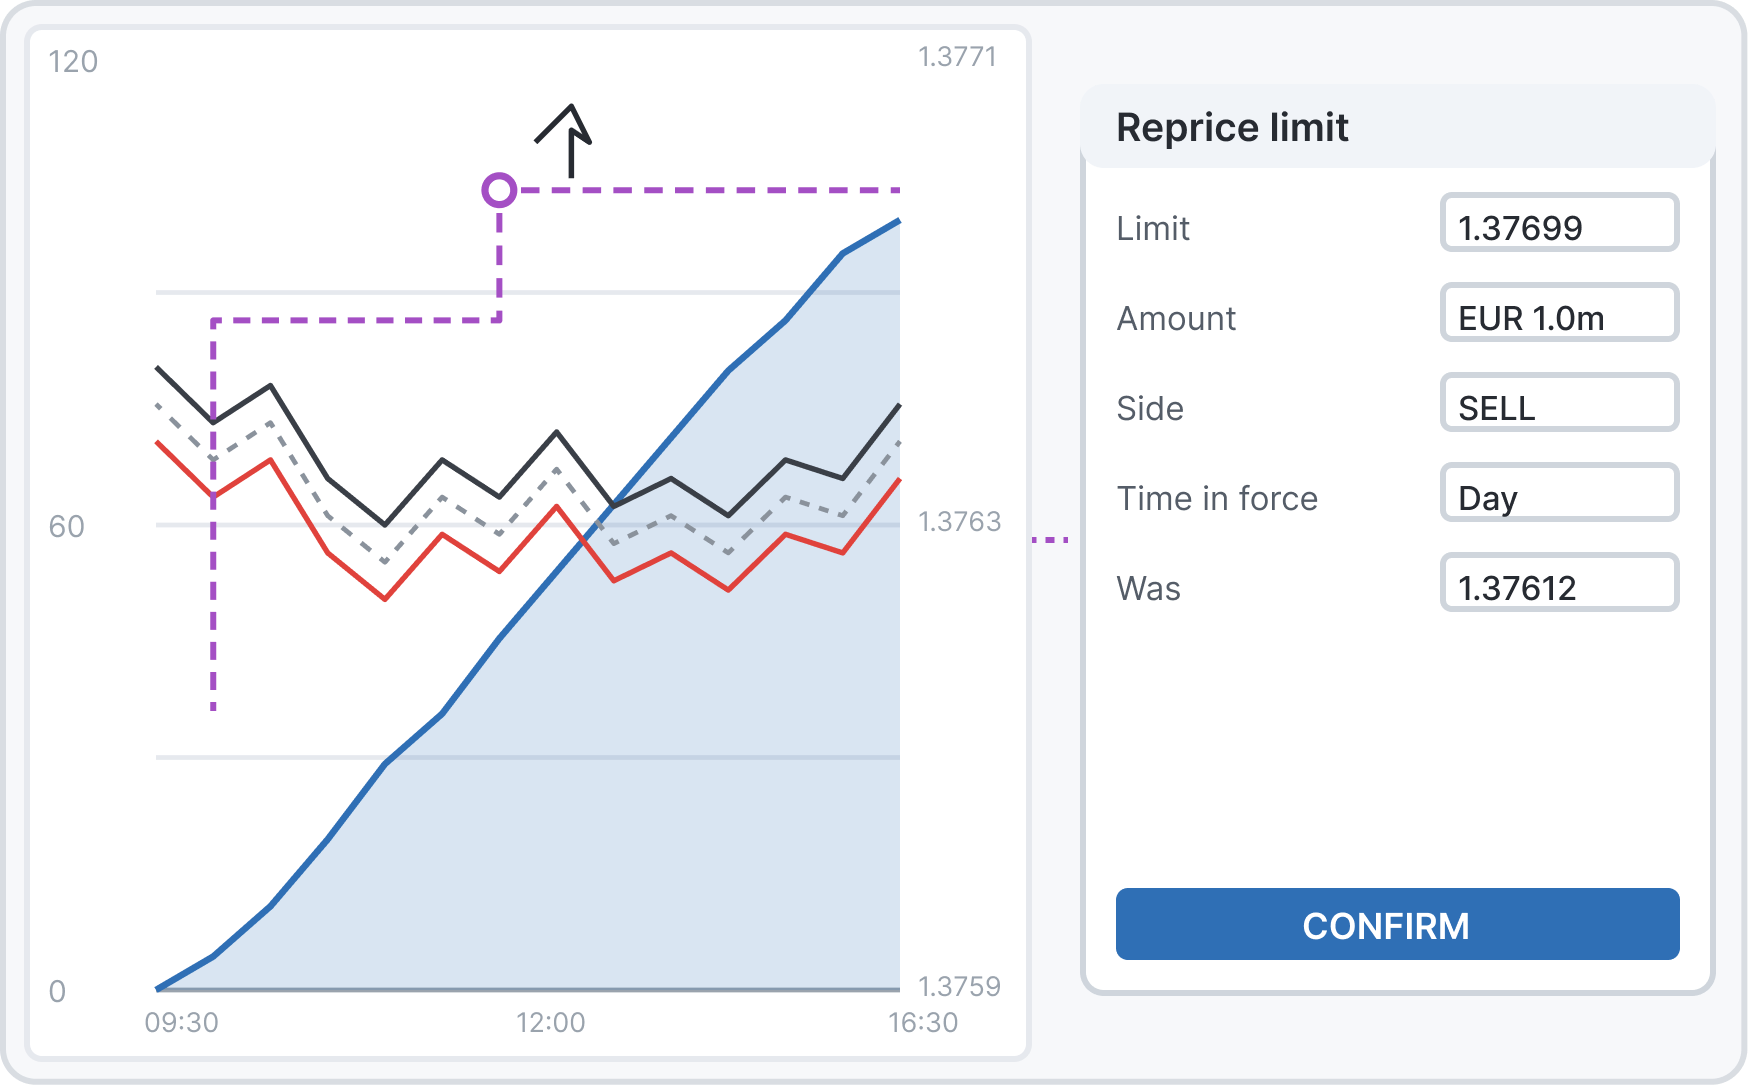
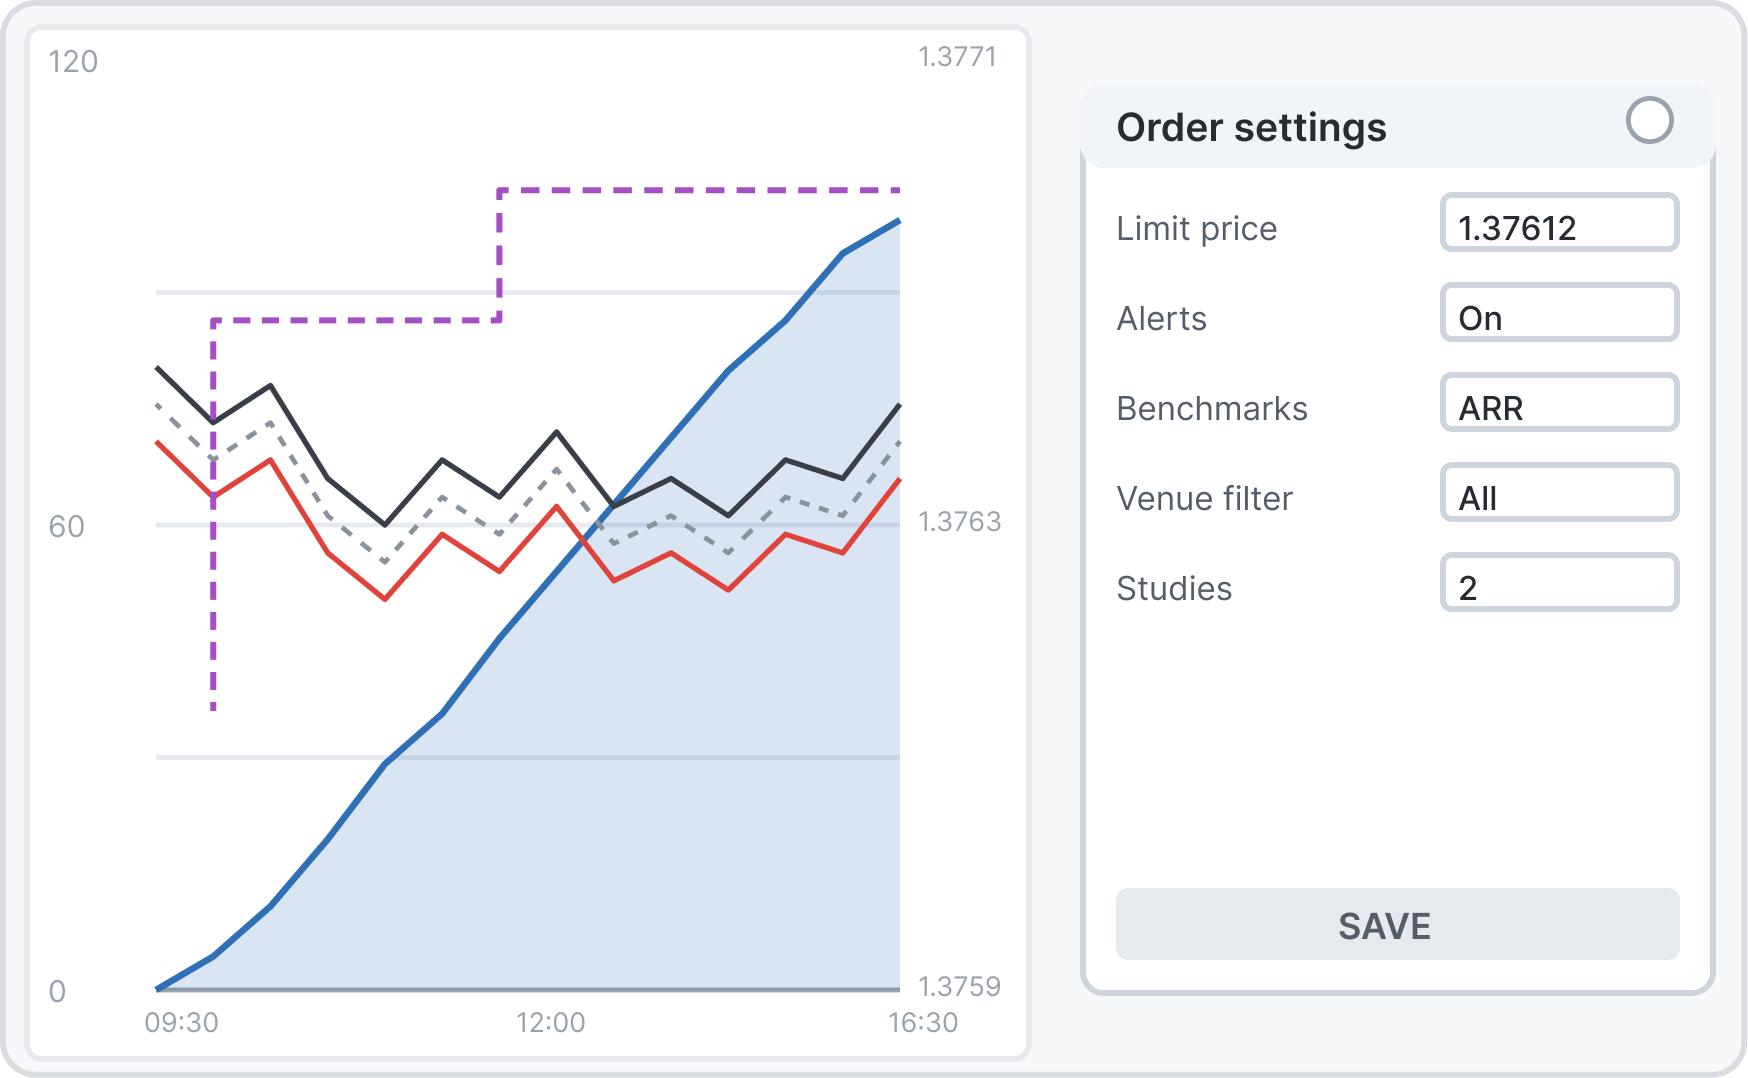
02Reprice on the chart, not in a settings menu
Where should a trader change the limit they are already watching?
The limit-price log showed repeated changes during an order. Repricing needed to be part of monitoring, with an explicit confirmation before it affected the order.
I chose
Drag-to-reprice on the price line
Drag the visible limit, then review the pre-filled ticket and confirm.
Alternative
A menu-based edit
Find the order setting, enter the new limit, then return to the chart.
Why I chose it
The limit price log showed orders being changed mid-flight. I reviewed a menu-based edit and drag-to-reprice with the business and charting vendor. I chose drag so the action stayed beside the price the trader was watching.
What it cost
Drag needs a safety step, so a pre-filled ticket sits between the gesture and the change.
What informed the decision
The limit-price log established the need. I compared the two options in the written specification with the business and charting vendor. That was a spec review, not a measured usability trial.
Reversed after implementation exploration
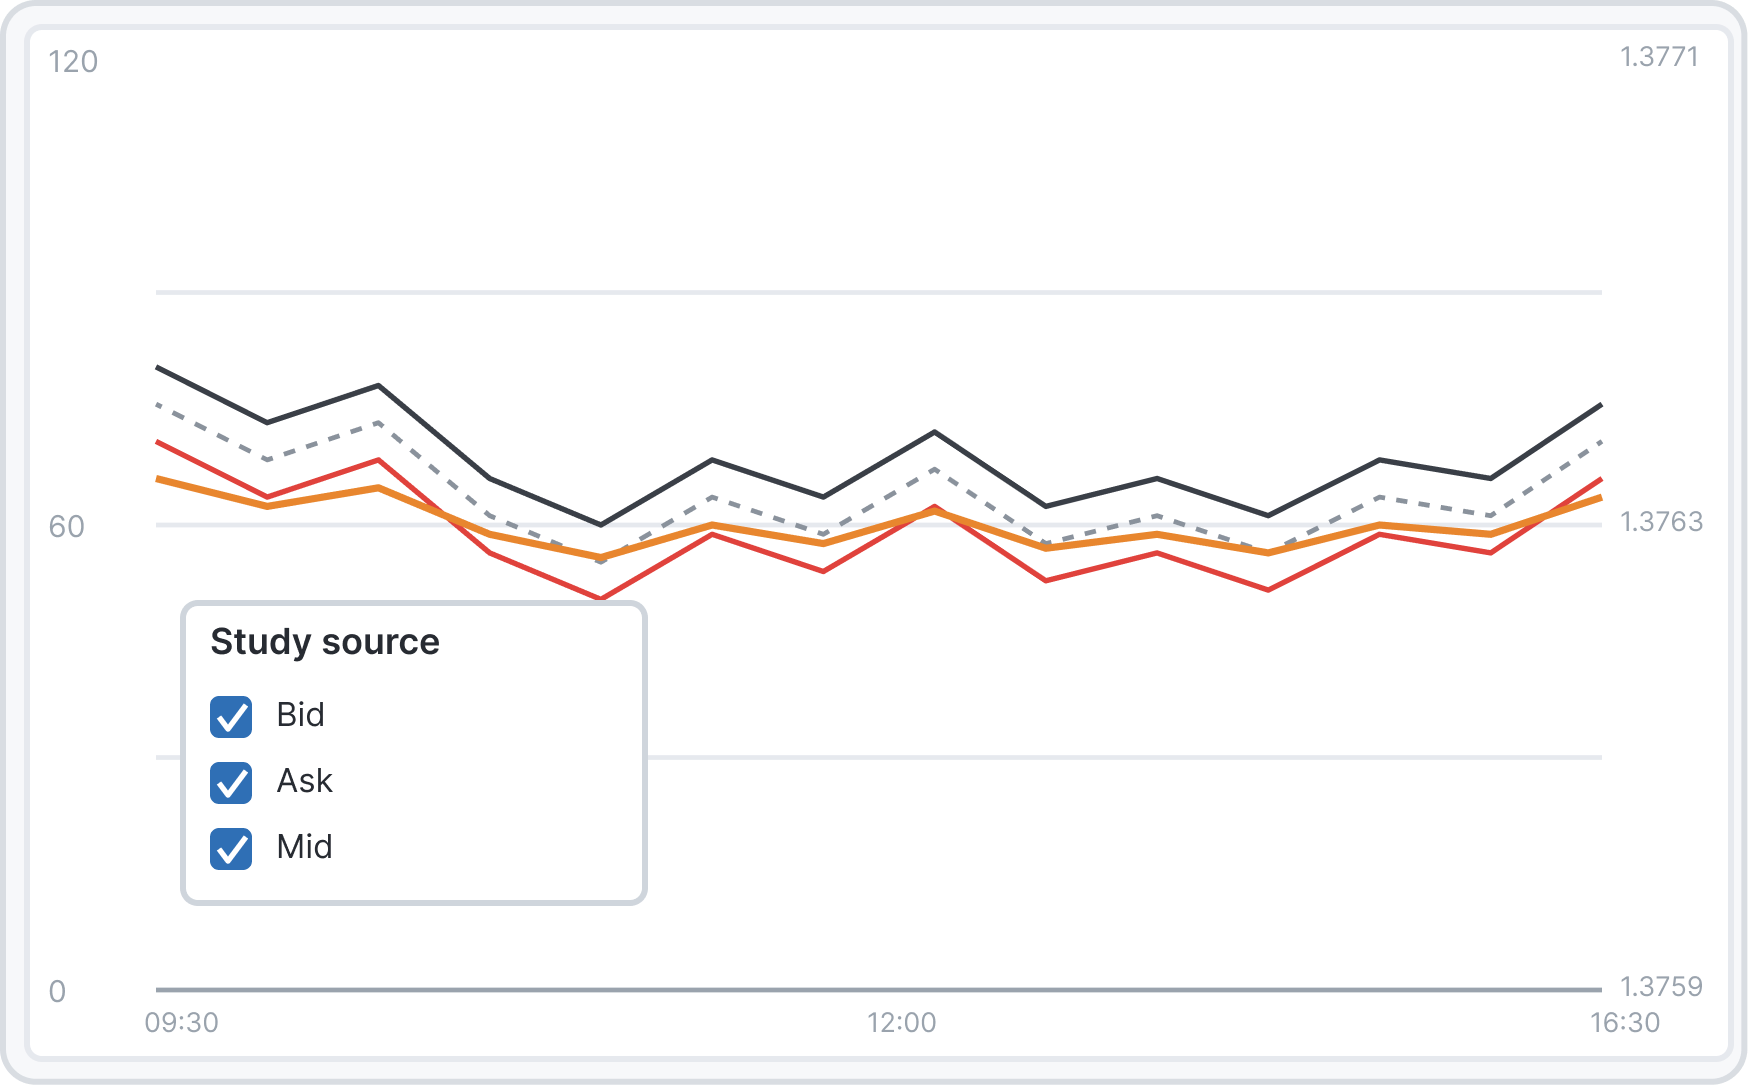
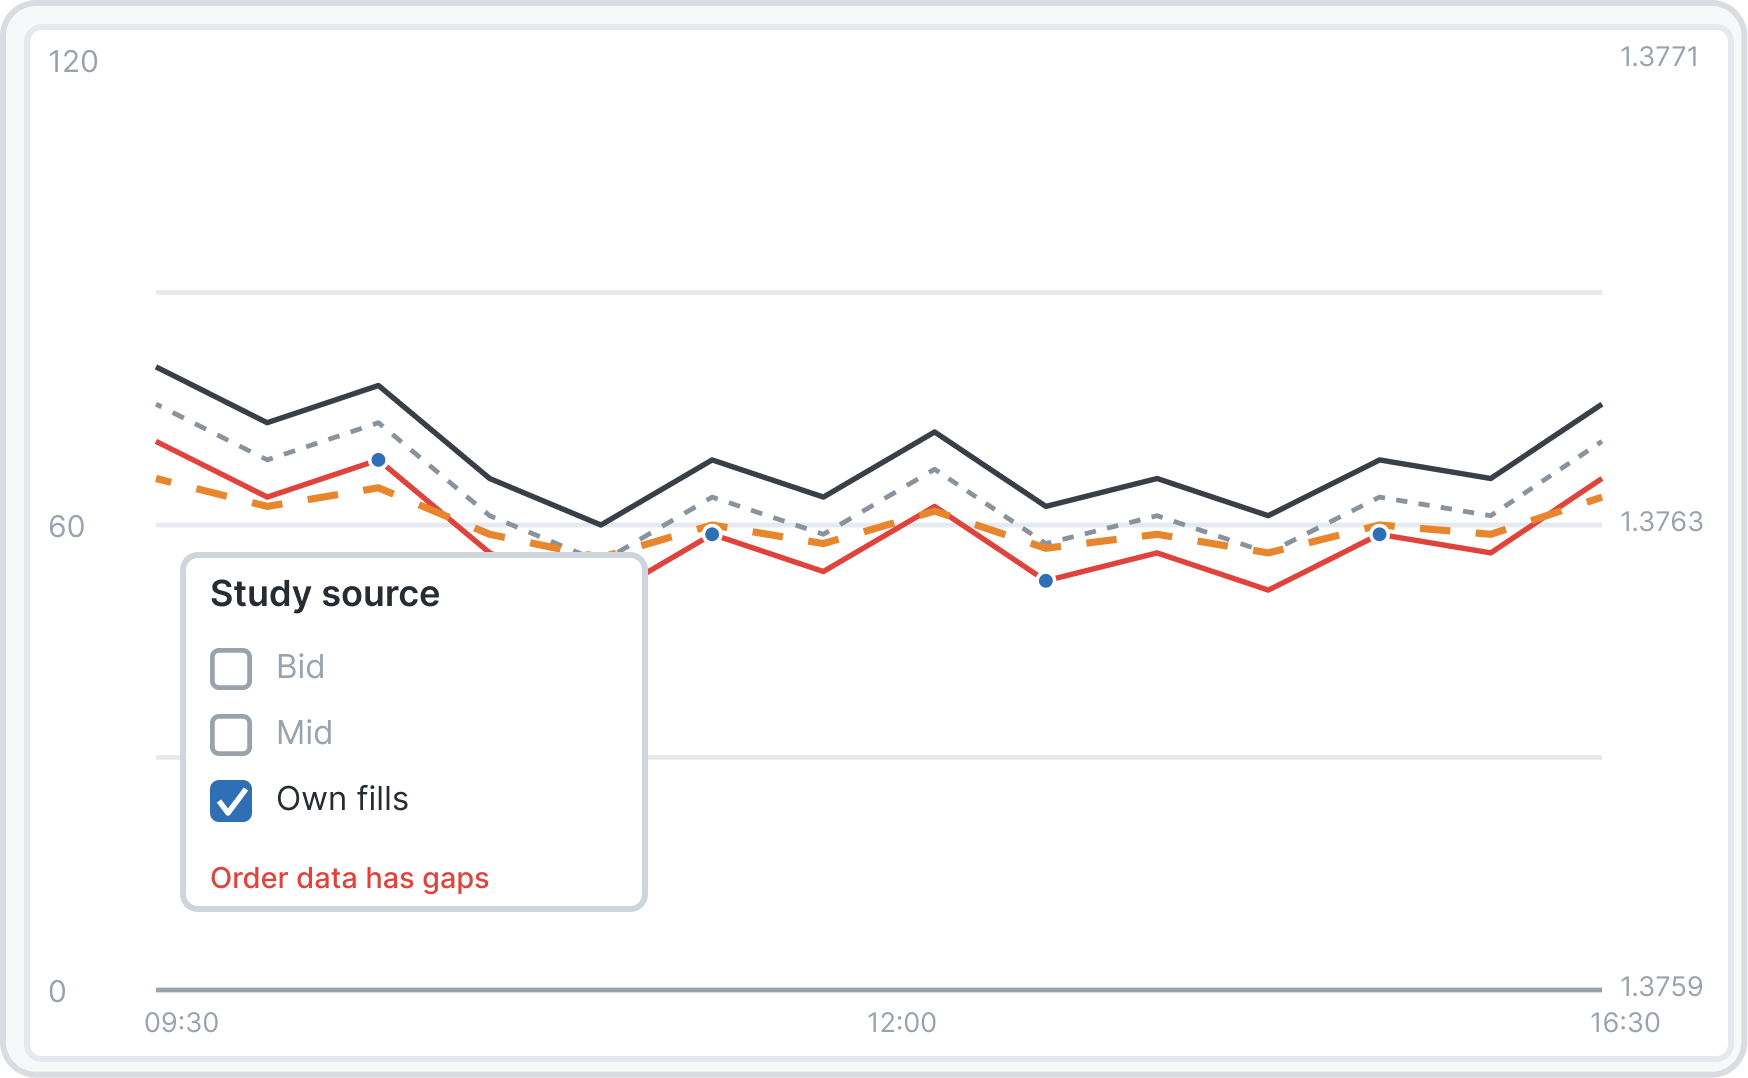
03Studies on market prices only. A decision I reversed
Which series are complete enough to support a study?
A study can look convincing even when its input is incomplete. Own fills only exist when the order trades, unlike continuous market-price series.
I chose
Bid, ask and mid only
Offer bid, ask and mid market prices as study sources.
Alternative
Any series, including the order’s own fills
Offer every plotted series, including the order’s own fills.
Why I chose it
My spec let analytics studies run on any series, including the order’s own fills. The vendor showed that order data has gaps, so a study on it looks confident and is wrong. I reversed it.
What it cost
Less flexibility. Studies cannot run on the order’s own fills, even when someone asks for it.
What informed the decision
This reversal came from rebuilding the surface in code with real-shaped data and checking the gaps with the vendor. It was a data and implementation finding, not a user-study result.
05 The full flow
Frommonitoringtoaction,withoutleavingthechart.
One workflow, two presentations
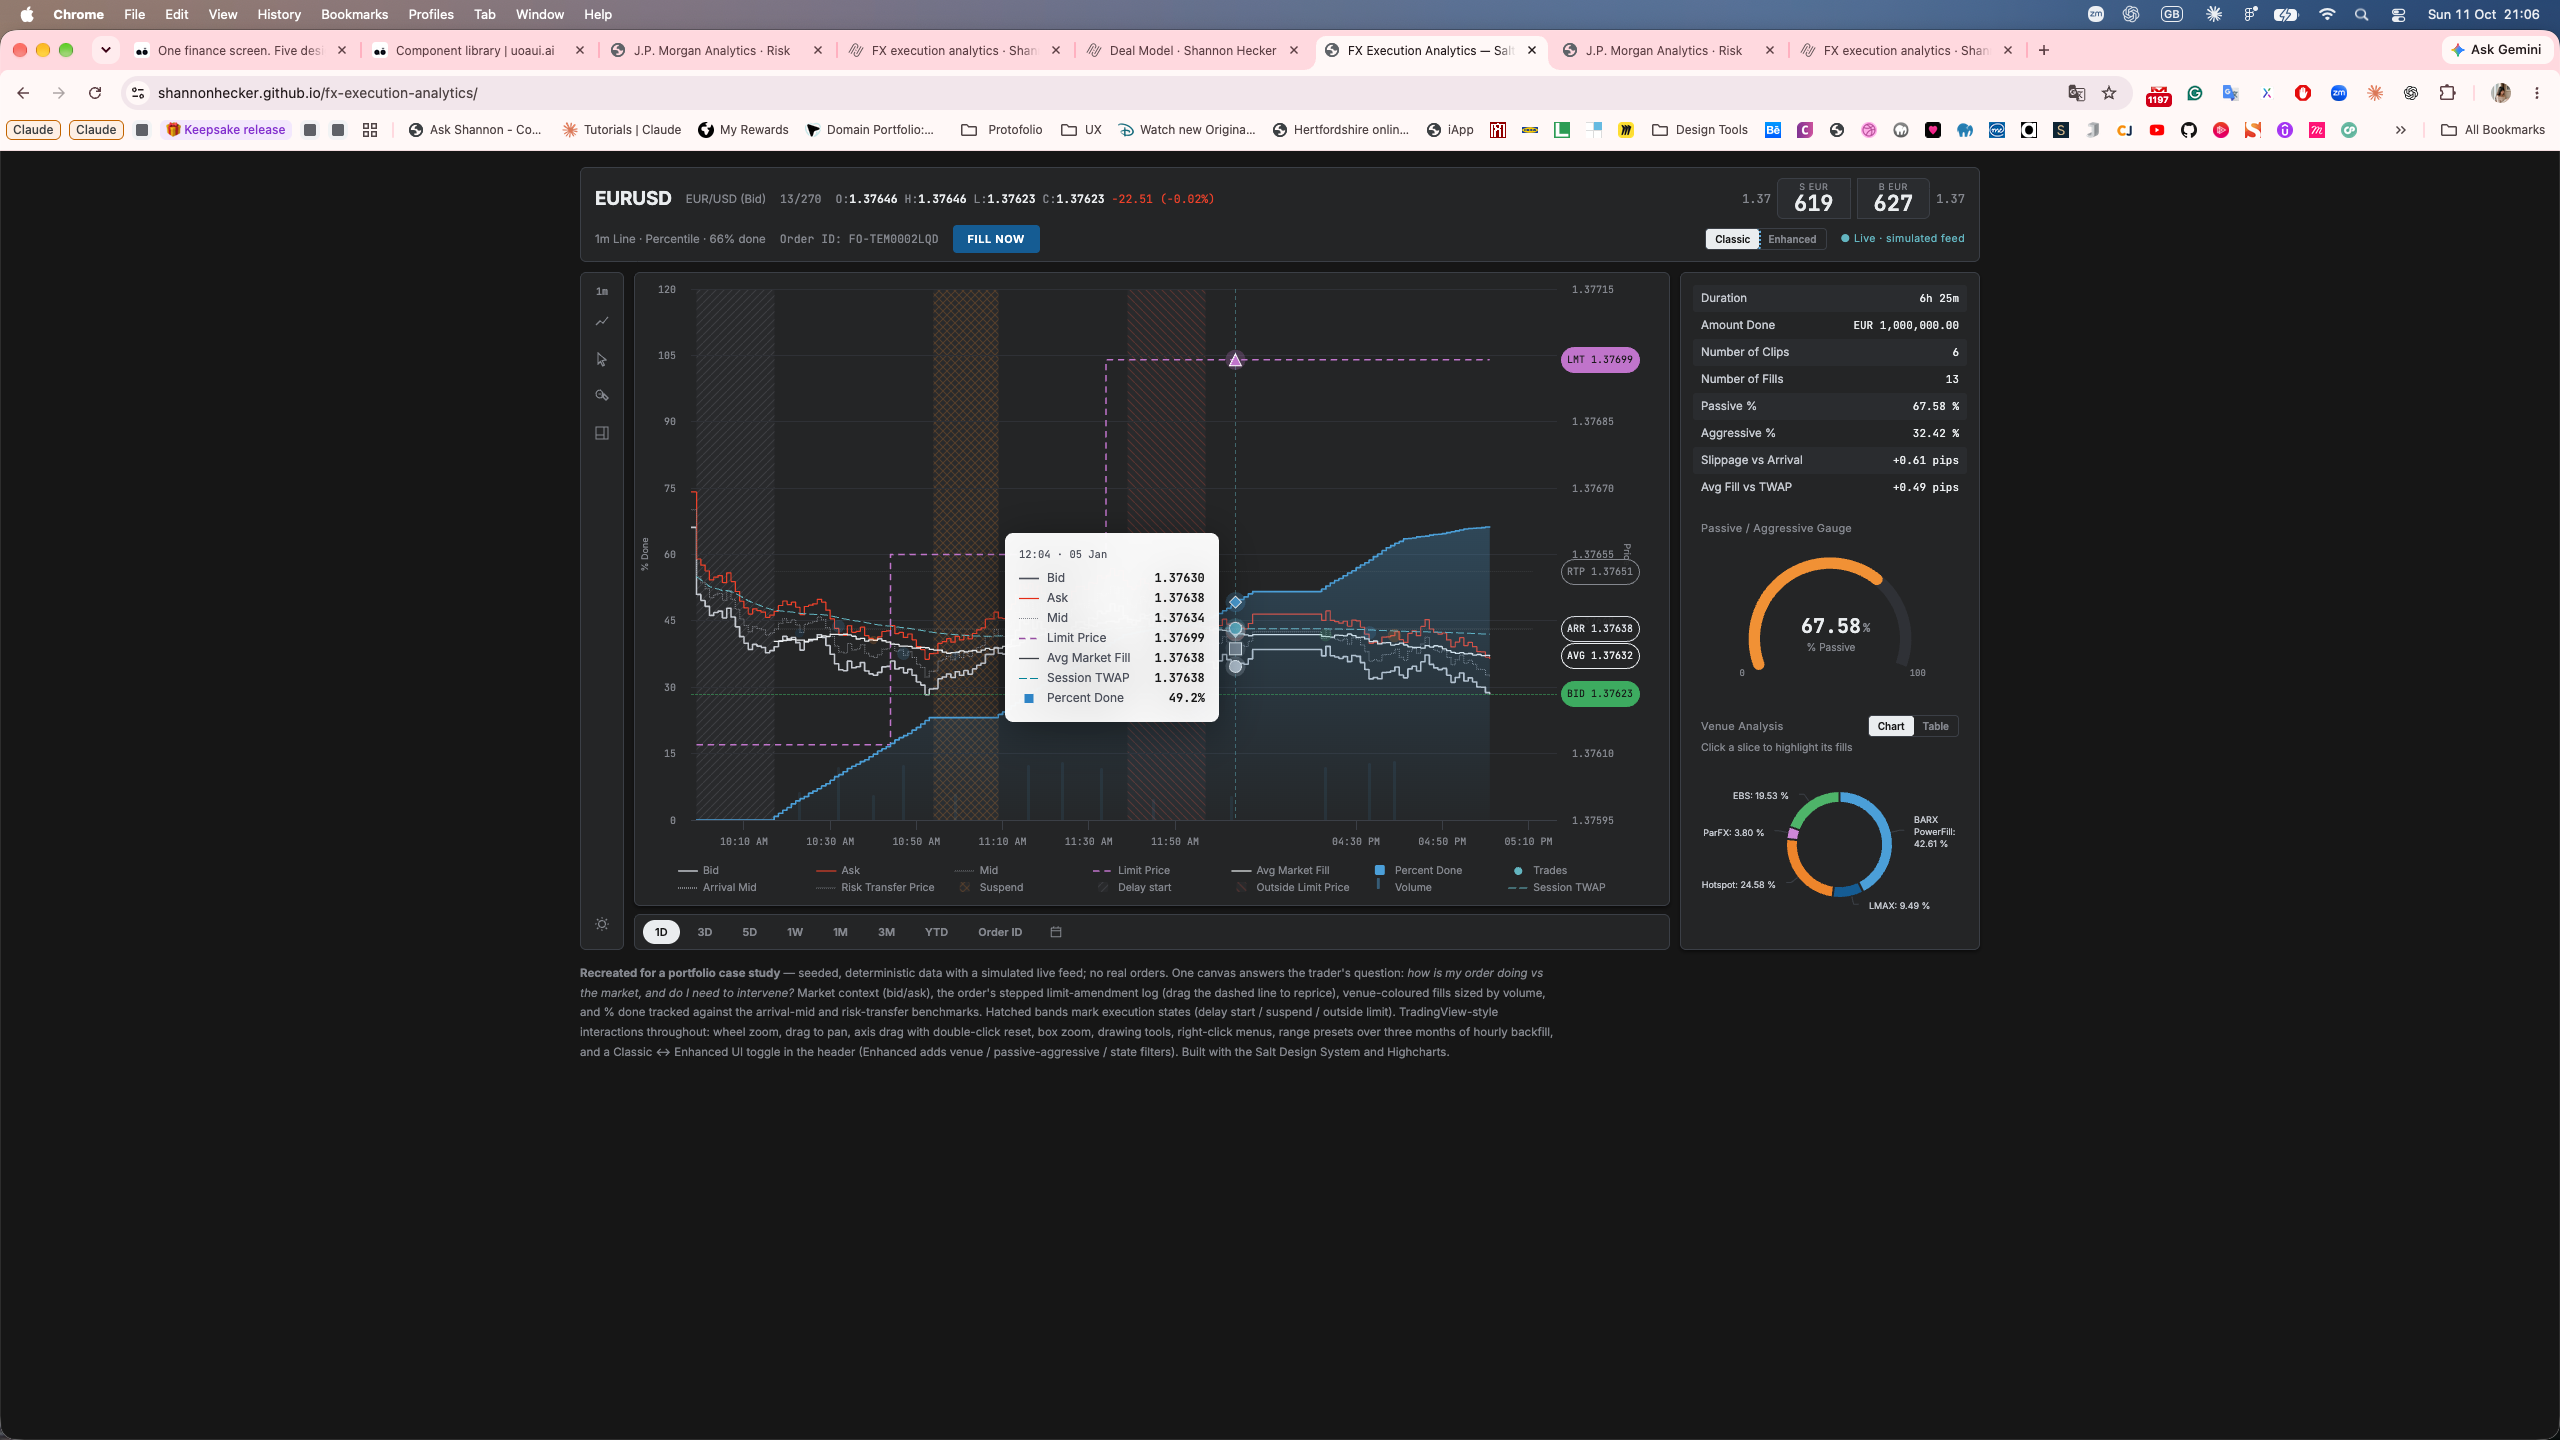
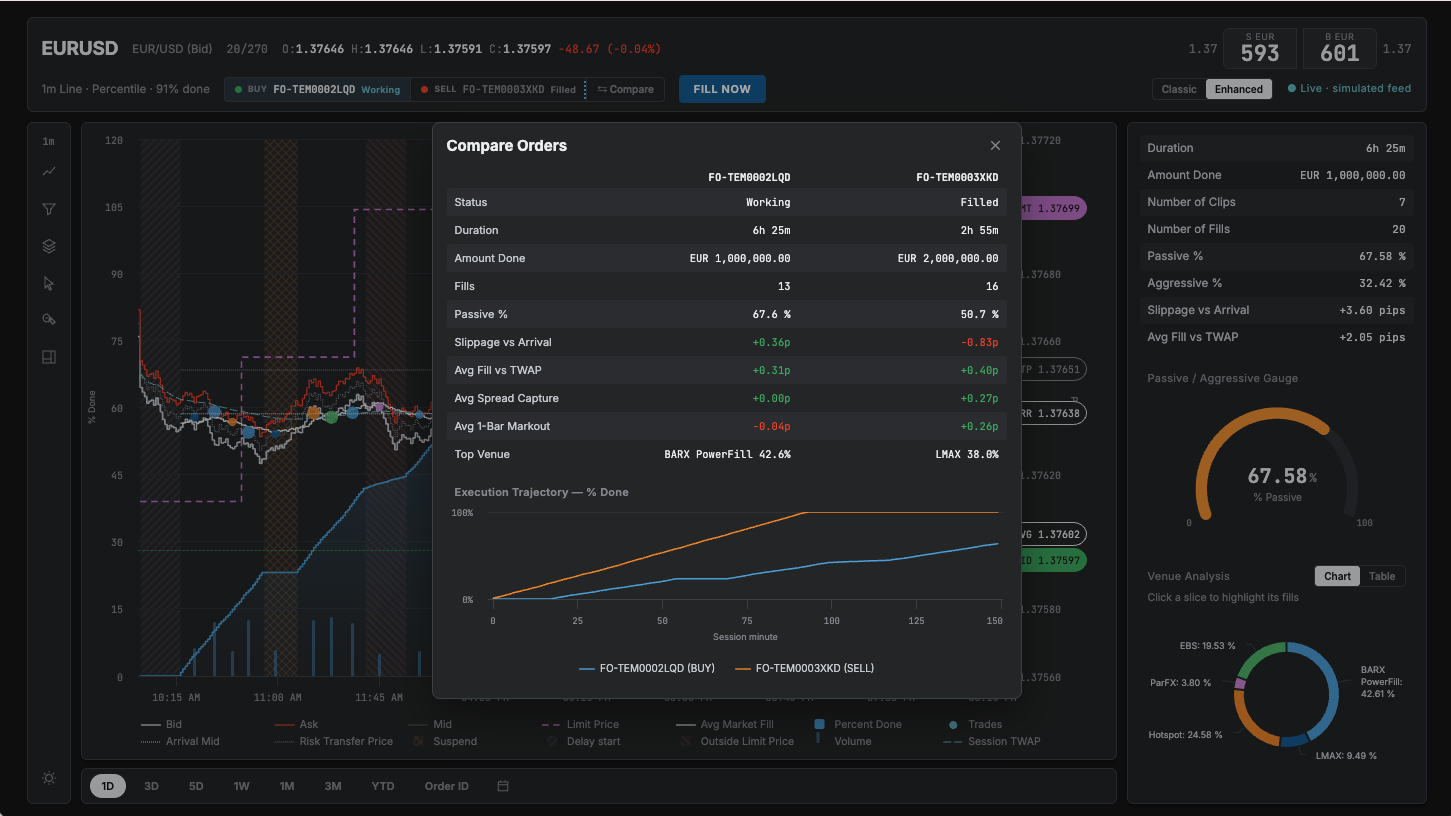
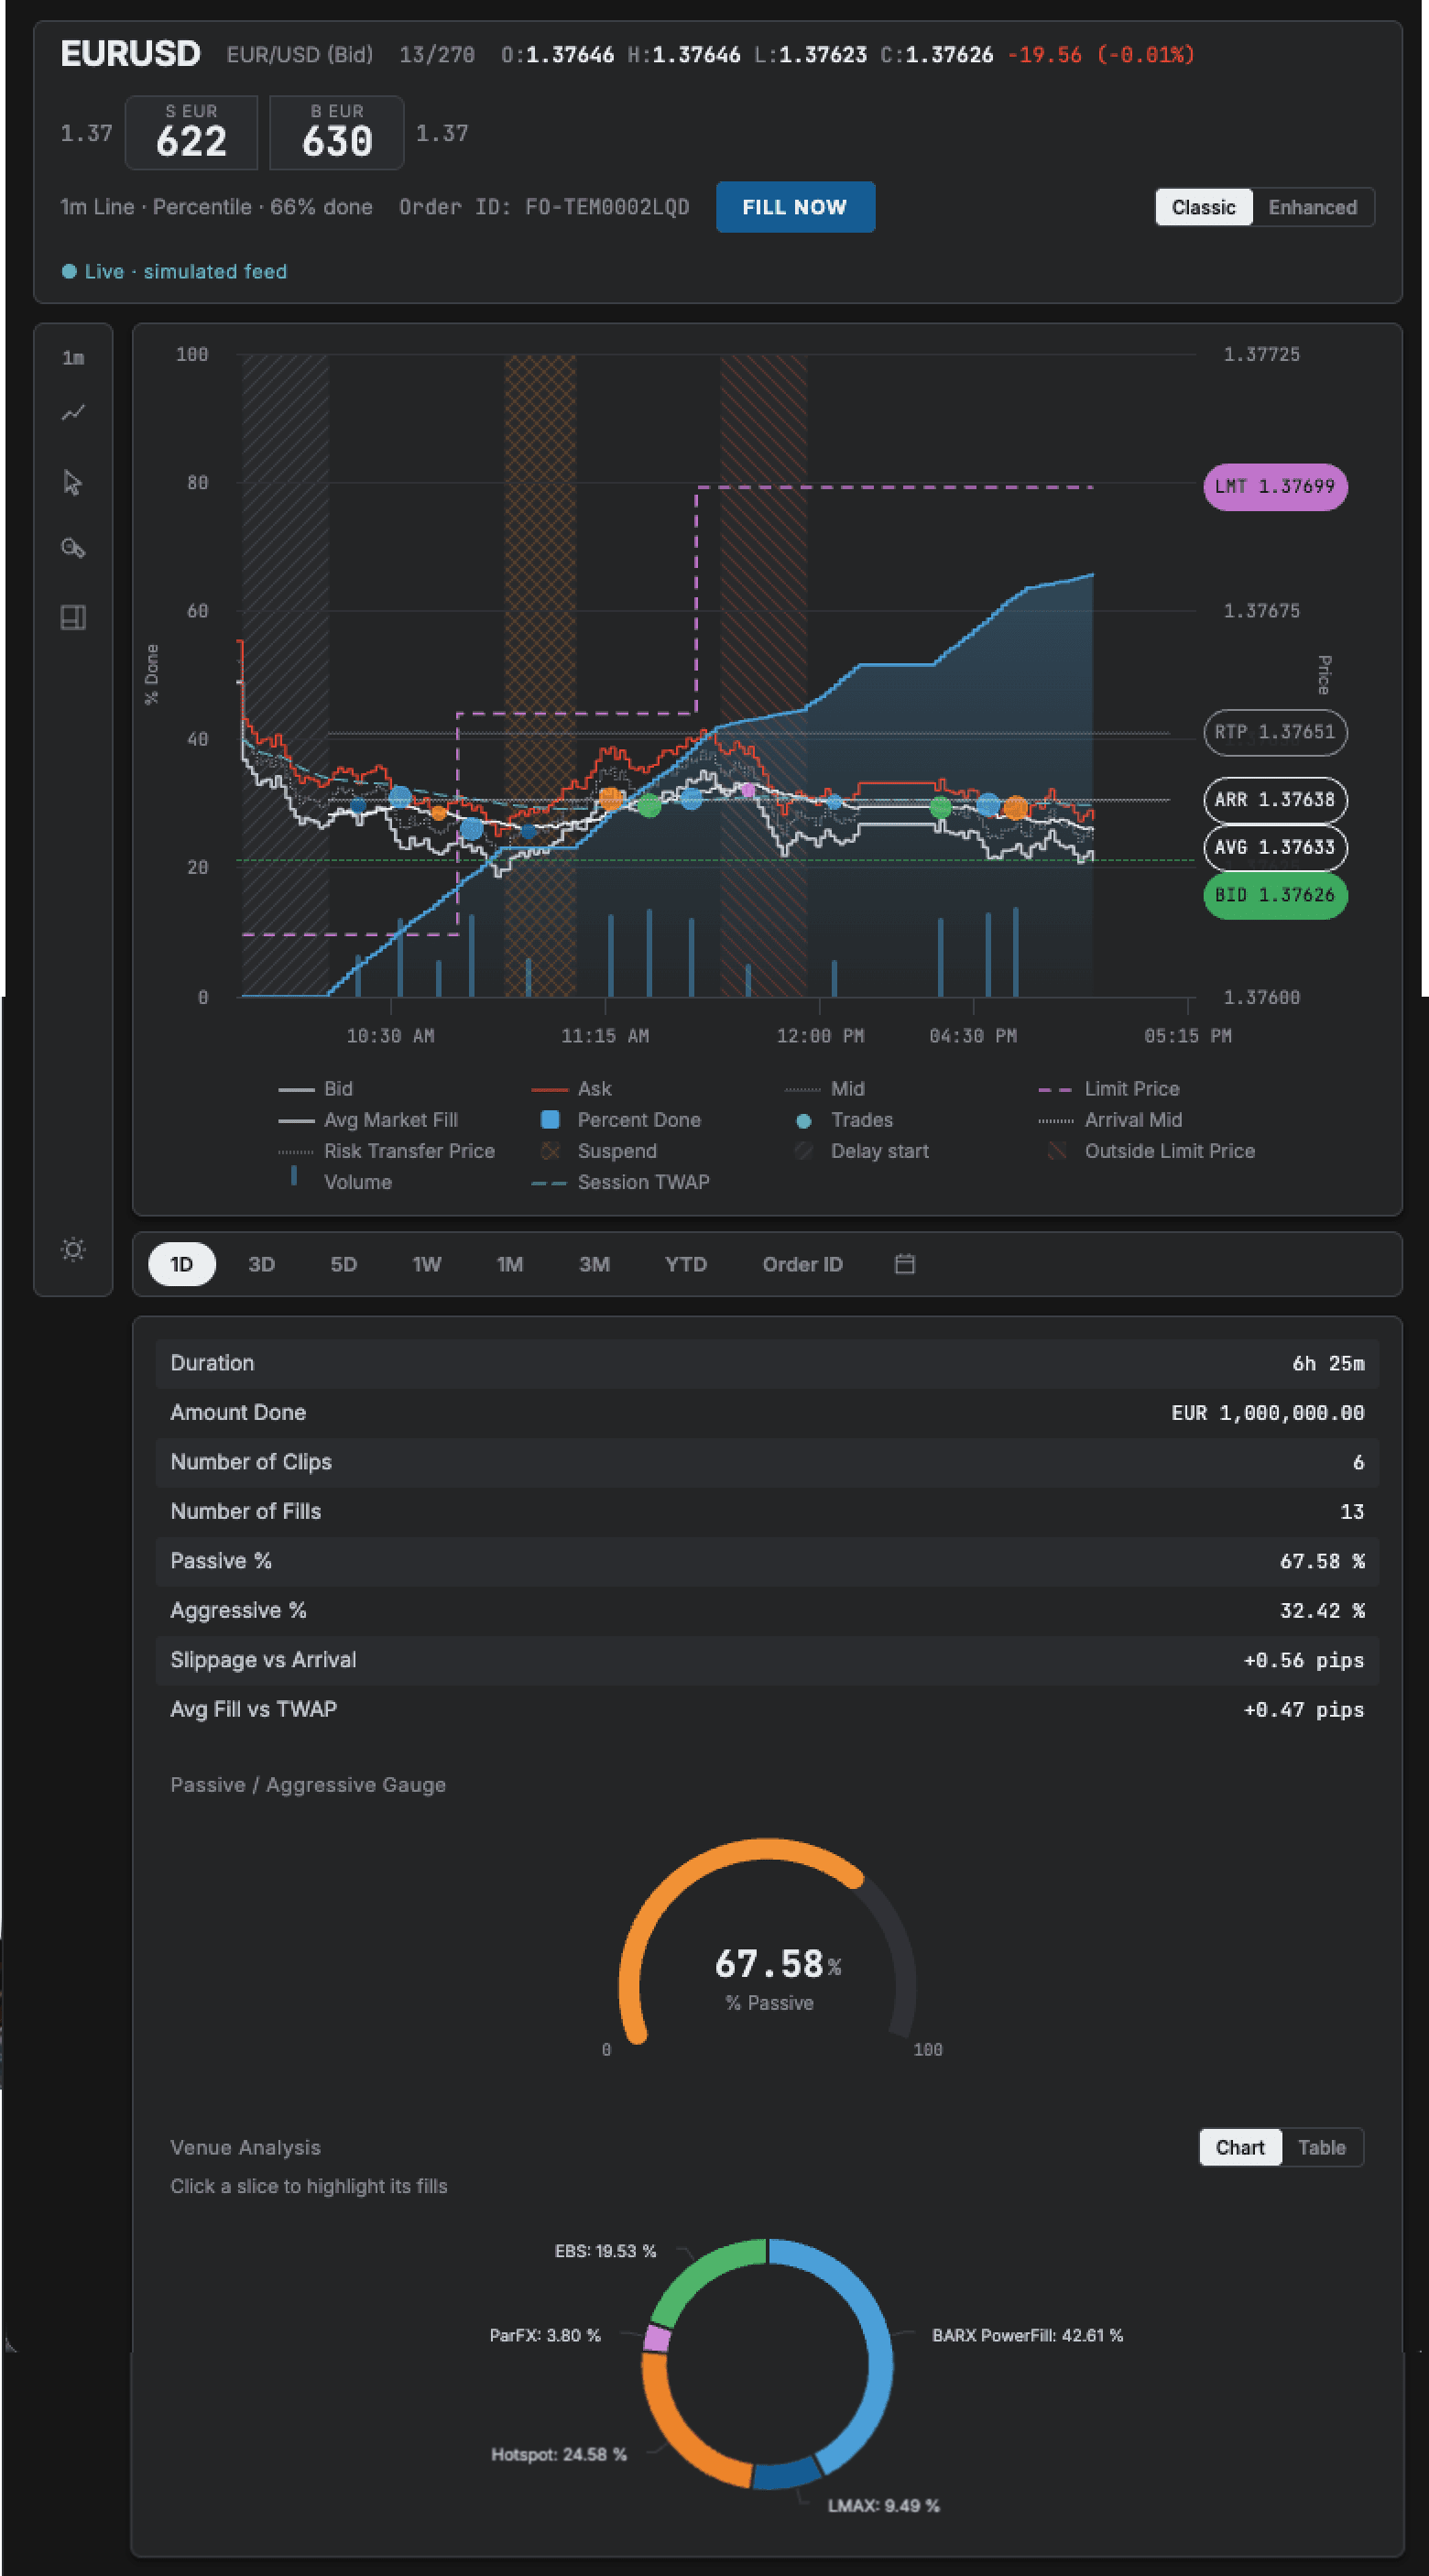
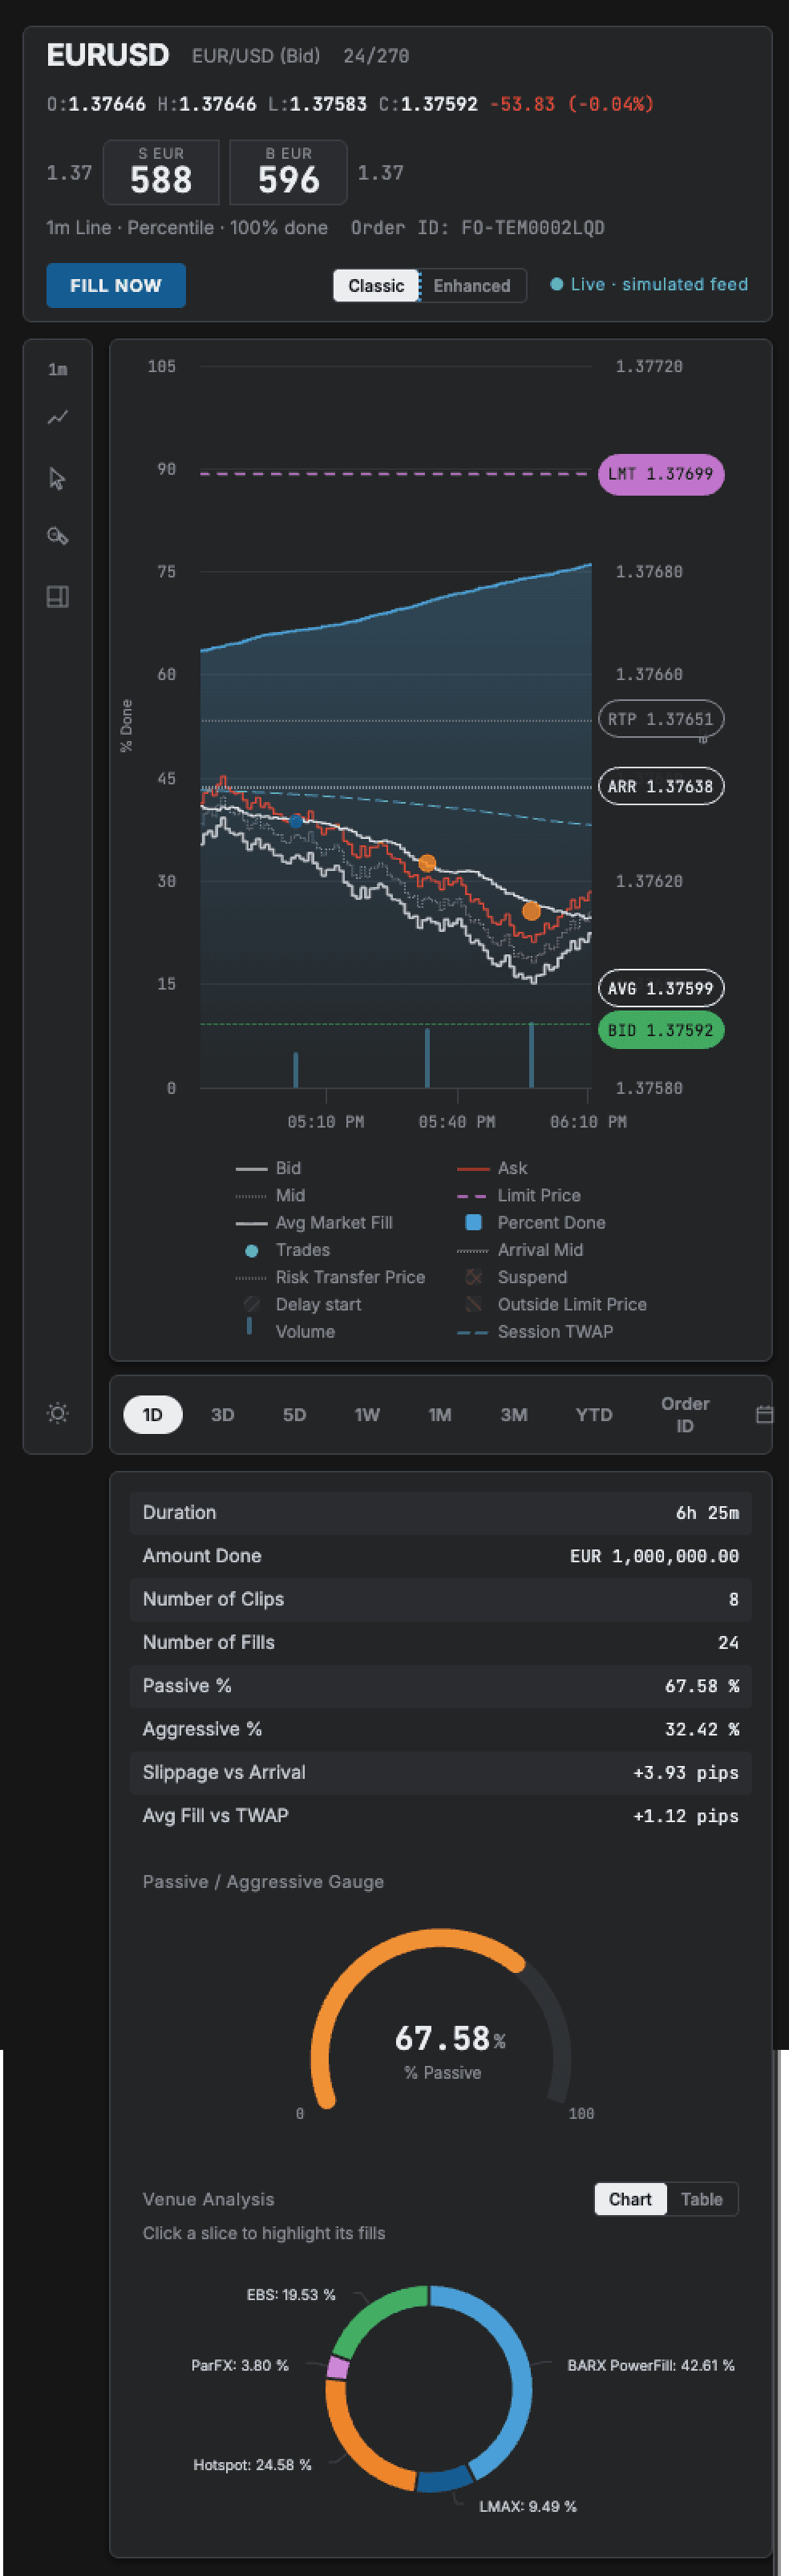
Classic represents the visual design I made at Barclays; Enhanced is my extension. These captures show my public rebuild with simulated data. It demonstrates chart interactions, not the full production confirmation and audit workflow.
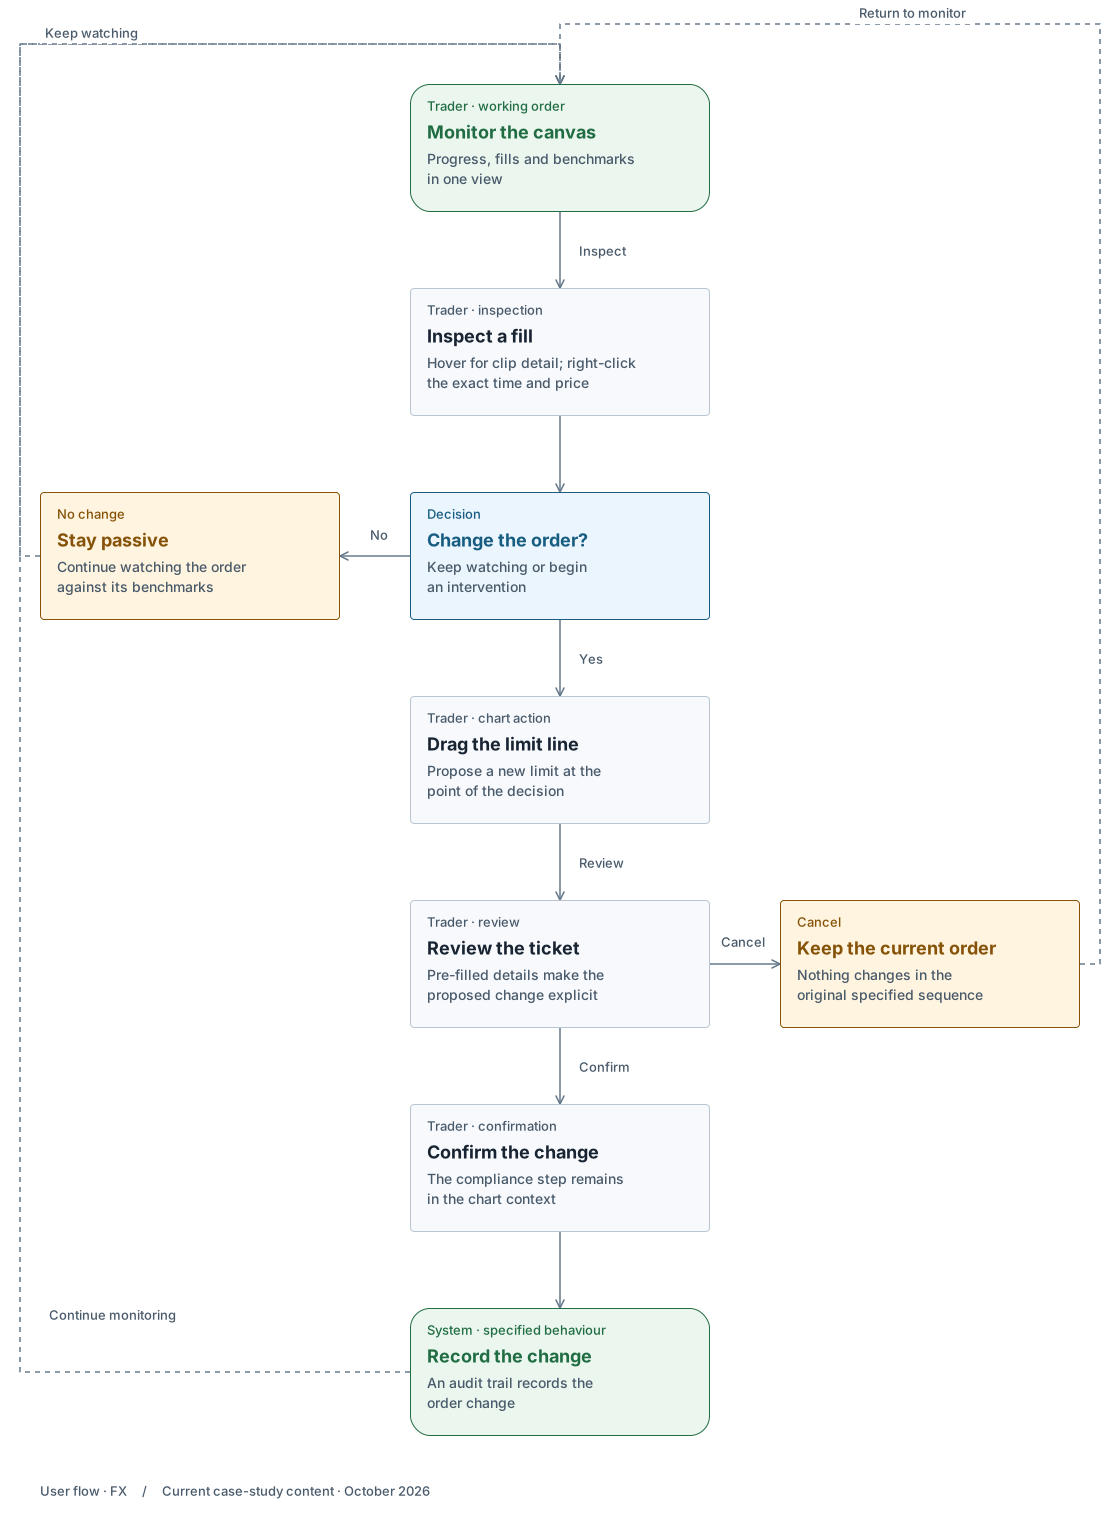
I specified a progressive flow from inspection to action: drag the limit, review the pre-filled ticket, confirm, then record the change. The sequence below is that design. In my current public rebuild, dragging the limit immediately changes the local simulated price. Dragging the BID pill opens a demo order ticket; submitting it shows feedback without placing a real order or writing an audit record.
Reprice flow · one intervention, step by step
This follows one branch of the decision loop above, the reprice, from the drag to the audit record. Trader inspects a working order, reviews a change and returns to monitoring.
Original specified flow · beta. Public rebuild uses simulated data and implements only part of this sequence.
On smaller screens, enlarge the flow to read and explore the branches.
Built in six phases
Theming and data integration first, then display, then interaction, and order submission last. Each phase reduced the risk of the next, and the desk got something usable early.
Too much on the axis, by design, for now
Phase one puts every attribute on screen on purpose, so the desk can tell us what matters instead of us guessing. Phase two adds entitlement-based templates per user type and a preference panel to hide attributes. Start wide, then narrow with evidence.
Two version-one debts and the next iteration
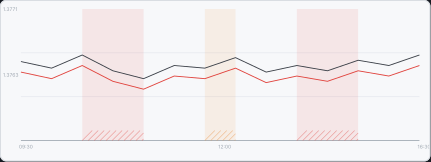
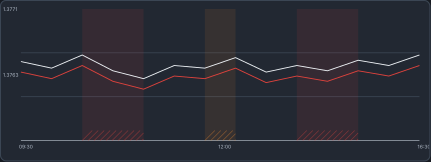
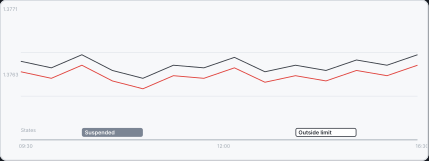
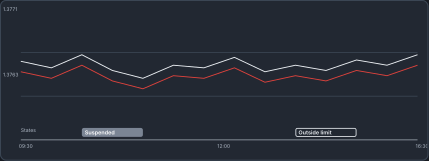
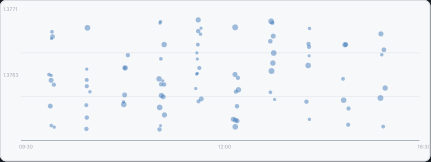
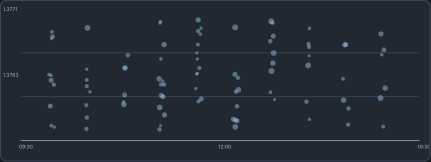
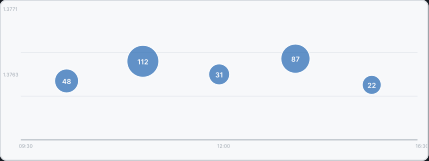
My public rebuild still uses patterned state regions and individual fill dots. The diagrams below show the refinements I designed: a separate state lane and counted clusters that expand on zoom. Patterned regions make the exceptional read as normal, and volume-sized dots become a smear at three hundred fills.
A compare view, because quality is relative
Execution quality only means something against a benchmark or another order, so I put a patient working order beside an urgent completed one, with the benchmark metrics in one table.
Today
States tiled the canvasPatterned regions sat behind the prices, so the exceptional read as normal.
Designed
States in their own laneA lane under the time axis. The price field stays quiet.
Today
A dot per fillVolume-sized dots were honest at twenty clips and a smear at three hundred.
Designed
Counted clustersFills group into clusters with a count, and expand on zoom.
06 Edge and validation states
Thestatesatraderhitswhenthingsarenotnormal.
Original specified and proposed states. The current public rebuild demonstrates a subset: it does not include confirmation on limit dragging, an audit backend, the separate state lane or counted clusters.
State
What the screen does
Why
Suspended, delayed start, outside limit
Each gets its own labelled band in a lane under the time axis.
The price field stays quiet, and the state is readable at a glance.
Drag to reprice
Opens a pre-filled ticket. Nothing changes until it is confirmed.
The specified confirmation gives the trader a chance to review the change before committing.
Colour-blind trader, washed-out screen
The design combines colour with line styles, fill markers and labelled order states. Favourable and adverse outcomes are named in text.
Keep labels and graphical cues alongside colour.
Hundreds of fills
Fills group into counted clusters that expand on zoom.
Honest at twenty clips and at three hundred.
A new order, no data yet
Empty, then loading, states in place of an empty chart.
The screen never looks broken while data arrives.
Dark room or bright room
Full light and dark themes.
Traders run dark rooms and sales run bright ones.
07 Status and planned measures
Whereitistoday,andhowitwillbemeasured.
6 build phases
The spec was accepted by business and vendor as the contract.
Beta
In use with internal users at Barclays today.
3 measures agreed for rollout
Price move to action, tool switches per order, usage per feature.
Silent recording. It opens the Enhanced view, works through the filter controls, compares orders, then opens the order ticket.
No adoption numbers yet. Rollout brings three measures, and I'll hold the design to them the way I hold the data. What I'd do differently: direct trader access earlier, instead of going through the business first. And the vendor's engine limits discovered in week one, not mid-spec.
Accessibility and responsiveness
Colour has supporting cues.
In the design, line styles, fill markers and labelled states support the colour coding. The legend below shows those encodings; it is not a claim of a completed accessibility audit of the public rebuild.
Across screen sizes
My public rebuild fits a tablet at 820px. At 390px the trading surface overflows sideways. It is a desk tool, and I don't claim mobile parity for it.